Advertisement
- Japan
- /
- Oil and Gas
- /
- TSE:5019
Is Idemitsu Kosan a Bargain After 6% Slide Amid Energy Market Shifts in 2025?

Simply Wall St
Reviewed by Bailey Pemberton
Thinking about what to do with Idemitsu KosanLtd stock? You’re definitely not alone. Over the last five years, this energy and chemicals giant has delivered an impressive 174.7% return that has caught the attention of everyone from cautious optimists to growth chasers. Yet, the last year paints a different picture, with shares sliding by 6.0%. Short-term shifts have been more muted: the stock dipped by 1.8% in the past week but has stayed almost flat for the last month, up just 0.9%. Despite the slight turbulence, the three-year return of 68.7% shows that long-term holders have been handsomely rewarded.
Investors are watching carefully as market dynamics evolve. Regulatory changes, global energy trends, and ongoing sector adjustments have made the recent price movements particularly interesting, as they hint at both growth opportunities and a re-rating of risk. But how does Idemitsu KosanLtd stack up when we dig into its valuation? Based on our core valuation checks, the company scores a 1 out of 6, meaning it is undervalued on just one metric so far, not exactly a slam dunk value play at first glance.
Of course, traditional valuation approaches are just the start. Next, we will break down where Idemitsu KosanLtd stands according to a variety of popular valuation methods, and later, we will introduce a perspective that could offer more insight than any checklist ever could.
Idemitsu KosanLtd scores just 1/6 on our valuation checks. See what other red flags we found in the full valuation breakdown.
Approach 1: Idemitsu KosanLtd Discounted Cash Flow (DCF) Analysis
The Discounted Cash Flow (DCF) model projects a company’s expected free cash flows into the future and discounts those amounts back to today’s value. This aims to estimate what the business is really worth based on its ability to generate cash.
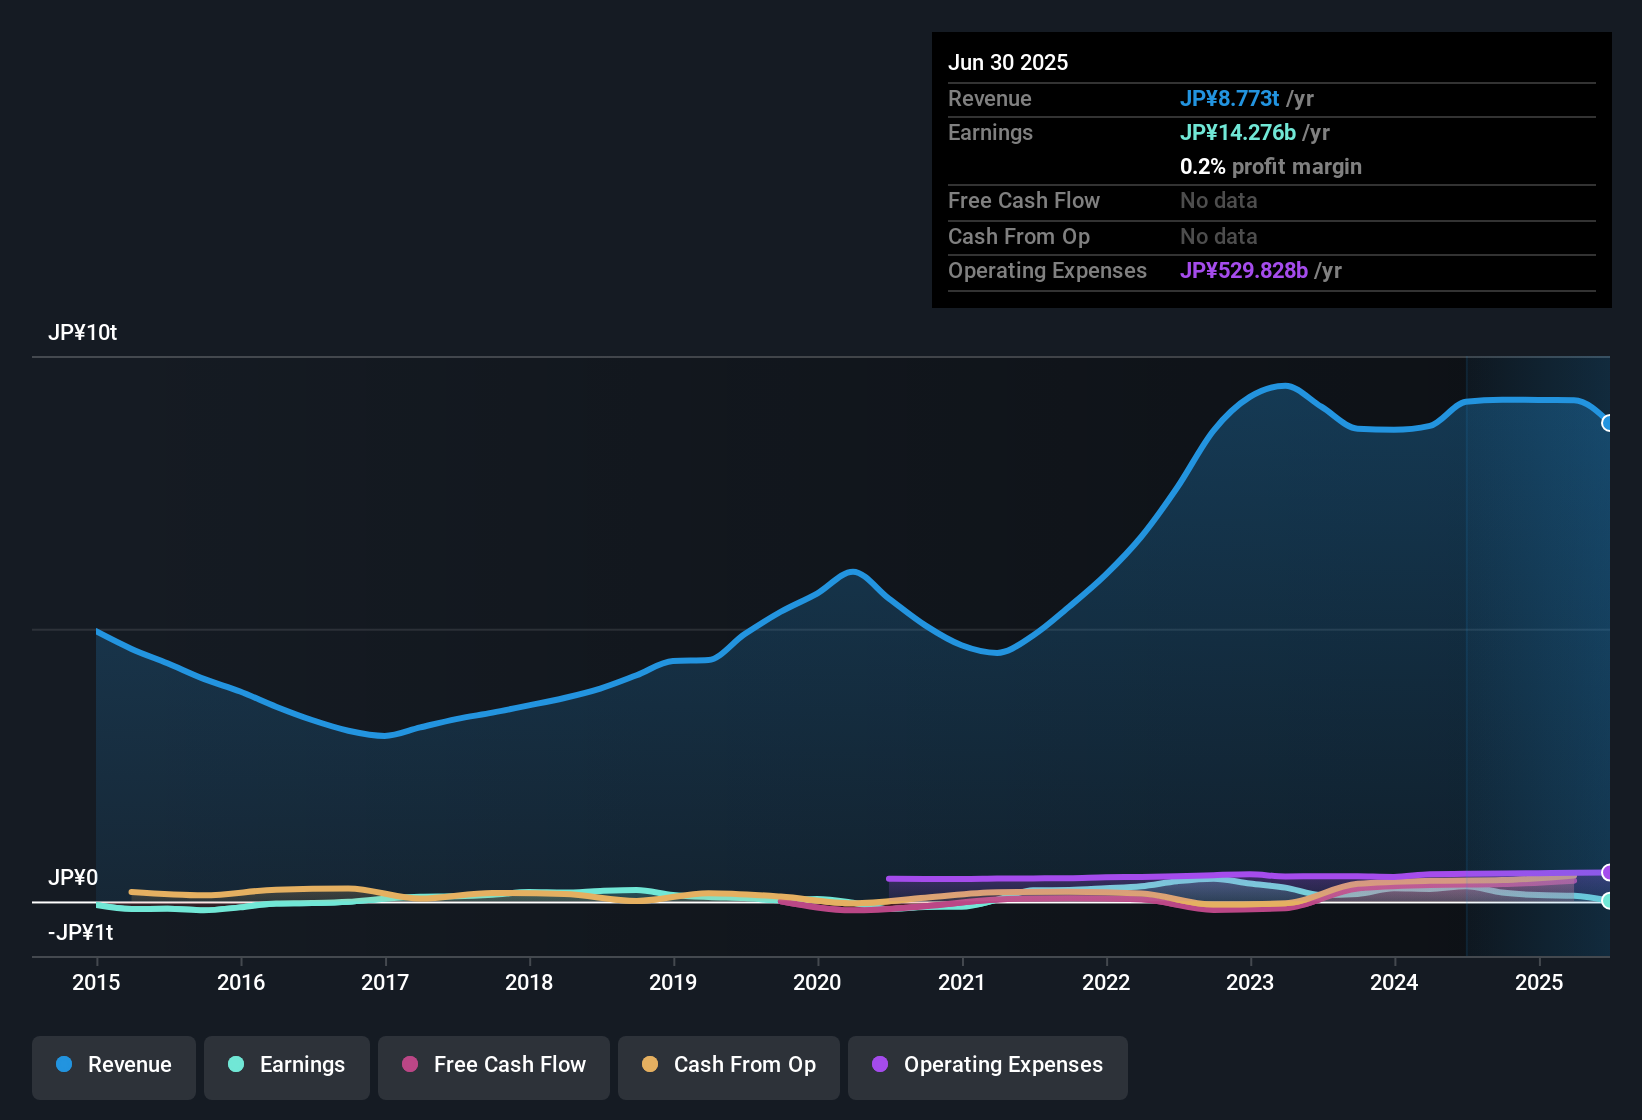
For Idemitsu KosanLtd, the current Free Cash Flow stands at ¥387.3 billion. Over the next several years, analyst projections show cash flows ranging from about ¥76.9 billion to ¥87.0 billion as we approach 2030, with further estimates provided up to 2035 based on extrapolations. These projections combine actual analyst consensus in the near term and model-driven estimates in the later years.
Taking these figures and discounting them back using the 2 Stage Free Cash Flow to Equity approach, the DCF model calculates an intrinsic value of ¥1,185.59 per share. At current levels, this implies Idemitsu KosanLtd stock is trading at a 13.9% discount to its fair value. In simple terms, the DCF suggests the shares are undervalued based on expected cash generation.
Result: UNDERVALUED
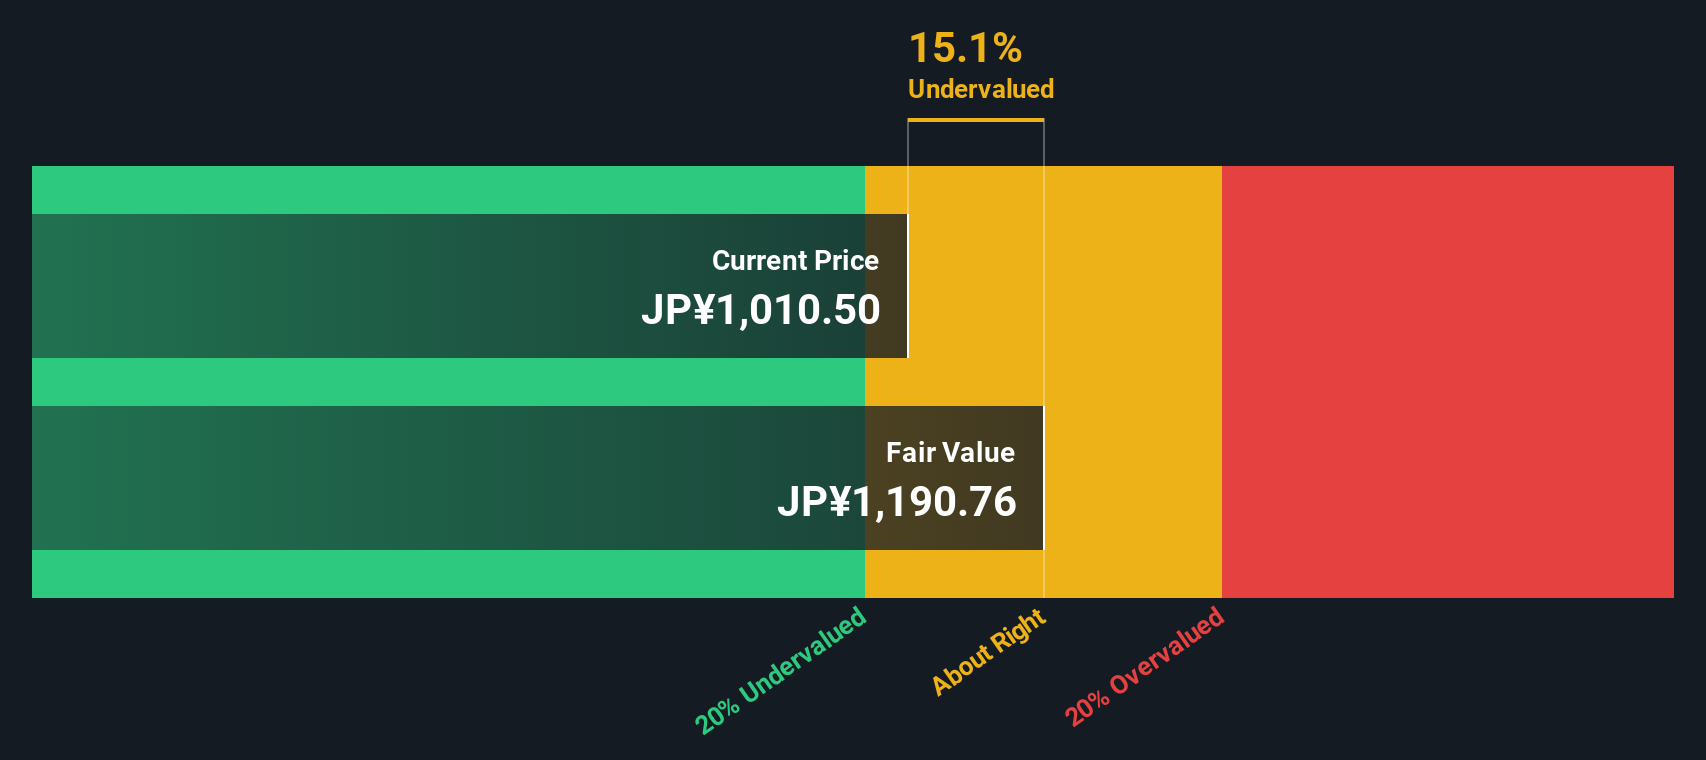
Our Discounted Cash Flow (DCF) analysis suggests Idemitsu KosanLtd is undervalued by 13.9%. Track this in your watchlist or portfolio, or discover more undervalued stocks.
Approach 2: Idemitsu KosanLtd Price vs Earnings
For profitable companies like Idemitsu KosanLtd, the Price-to-Earnings (PE) ratio serves as a straightforward tool to gauge how much investors are willing to pay for a slice of the company's profits. In essence, this metric helps investors cut through the noise by showing what you pay for each ¥1 of earnings. This is a handy reference when comparing with others in the same industry.
Of course, a “normal” or “fair” PE ratio depends on several moving parts. Companies with stronger growth prospects, lower business risks, or a history of stable profitability often command higher multiples, while struggling or more volatile peers typically trade lower. Context really matters when making judgement calls based on the PE ratio alone.
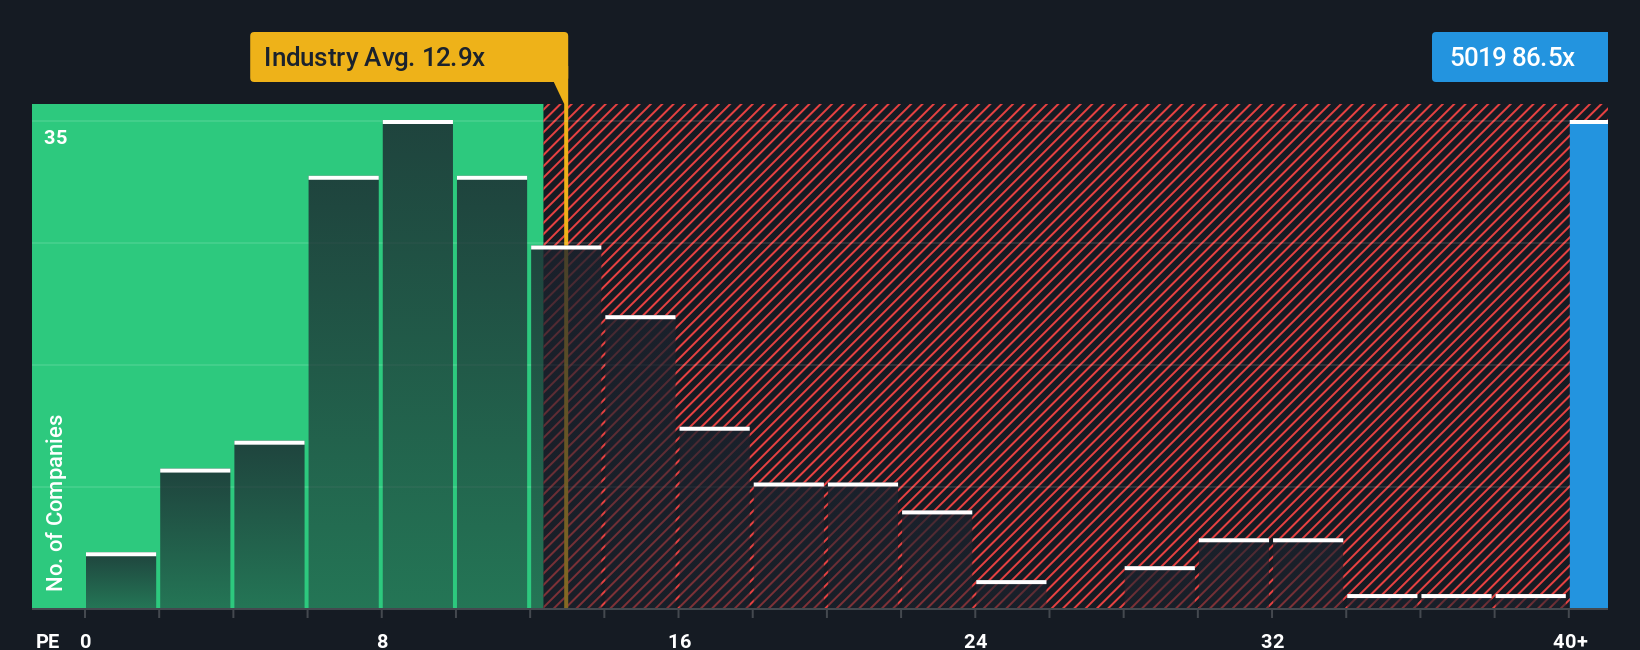
Currently, Idemitsu KosanLtd is trading at a high PE of 87.54x, noticeably above both the industry average of 12.96x and the average of direct peers at 15.14x. While that might raise eyebrows, Simply Wall St’s proprietary Fair Ratio at 20.48x offers a more nuanced benchmark. This Fair Ratio is not just an average; it incorporates specifics like future earnings growth, profit margins, market cap and risks. By accounting for all these company-specific details, it gives a more tailored view of what Idemitsu KosanLtd “should” be valued at.
Comparing the Fair Ratio and the actual PE multiple, the current valuation is well above what is justified given the company’s profile and prospects, signaling that shares appear overvalued based on this method.
Result: OVERVALUED
PE ratios tell one story, but what if the real opportunity lies elsewhere? Discover companies where insiders are betting big on explosive growth.
Upgrade Your Decision Making: Choose your Idemitsu KosanLtd Narrative
Earlier we mentioned that there is an even better way to understand valuation, so let's introduce you to Narratives. A Narrative is a simple but powerful concept: it is your story behind the numbers. With Narratives, you set your view on a company's future revenue, profit margins, and fair value. Instead of just accepting consensus estimates, Narratives let you connect the company’s story to a financial forecast and then see what price you believe is actually fair.
On Simply Wall St’s Community page, used by millions of investors, Narratives are an easy way to visualize and share your perspective. They help you quickly compare your estimate of fair value with the latest market price, so you can decide when stocks like Idemitsu KosanLtd may be great buys or timely sales.
What makes Narratives unique is that they are dynamic and automatically update when new news, earnings, or other key events change the outlook. For example, one investor might see Idemitsu KosanLtd’s fair value as very high due to optimistic cash flow growth, while another might expect a much lower value based on conservative profit margin forecasts. Narratives empower you to invest with both numbers and your view of the company’s future in mind.
Do you think there's more to the story for Idemitsu KosanLtd? Create your own Narrative to let the Community know!
This article by Simply Wall St is general in nature. We provide commentary based on historical data and analyst forecasts only using an unbiased methodology and our articles are not intended to be financial advice. It does not constitute a recommendation to buy or sell any stock, and does not take account of your objectives, or your financial situation. We aim to bring you long-term focused analysis driven by fundamental data. Note that our analysis may not factor in the latest price-sensitive company announcements or qualitative material. Simply Wall St has no position in any stocks mentioned.
New: AI Stock Screener & Alerts
Our new AI Stock Screener scans the market every day to uncover opportunities.
• Dividend Powerhouses (3%+ Yield)
• Undervalued Small Caps with Insider Buying
• High growth Tech and AI Companies
Or build your own from over 50 metrics.
Have feedback on this article? Concerned about the content? Get in touch with us directly. Alternatively, email editorial-team@simplywallst.com
About TSE:5019
Idemitsu KosanLtd
Engages in the petroleum, basic chemicals, functional materials, power and renewable energy, and resources businesses in Japan and internationally.
Excellent balance sheet average dividend payer.
Similar Companies
Market Insights

Advertisement
Community Narratives
The Next Phase of Energy Storage: How NeoVolta Is Tackling America’s Power Crunch
Fair Value US$7.50|35.1% undervalued
MA
Community Contributor
Why EnSilica is Worth Possibly 13x its Current Price
Fair Value UK£5.00|89.5% undervalued
DO
Community Contributor
M&A Activity, Industry Diversification & A Defense Contract Monopoly Will Push BWXT For Healthy Long-Term Growth
Fair Value US$220.00|15.2% undervalued
CL
Community Contributor
A case for Cassiar Gold Corp (TSXV: GLDC) to reach CAD$8-10 before 2030 (X30-37)
Fair Value CA$10.00|96.0% undervalued
AG
Community Contributor