
Advertisement
- Japan
- /
- Capital Markets
- /
- TSE:8746
Take Care Before Jumping Onto Daiichi Commodities Co.,Ltd. (TSE:8746) Even Though It's 27% Cheaper

Daiichi Commodities Co.,Ltd. (TSE:8746) shares have retraced a considerable 27% in the last month, reversing a fair amount of their solid recent performance. Still, a bad month hasn't completely ruined the past year with the stock gaining 35%, which is great even in a bull market.
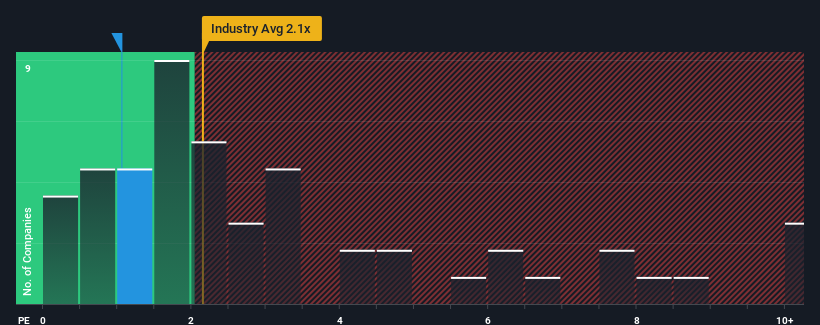
Although its price has dipped substantially, Daiichi CommoditiesLtd's price-to-sales (or "P/S") ratio of 1.1x might still make it look like a buy right now compared to the Capital Markets industry in Japan, where around half of the companies have P/S ratios above 2.1x and even P/S above 5x are quite common. Nonetheless, we'd need to dig a little deeper to determine if there is a rational basis for the reduced P/S.
See our latest analysis for Daiichi CommoditiesLtd
What Does Daiichi CommoditiesLtd's P/S Mean For Shareholders?
As an illustration, revenue has deteriorated at Daiichi CommoditiesLtd over the last year, which is not ideal at all. One possibility is that the P/S is low because investors think the company won't do enough to avoid underperforming the broader industry in the near future. If you like the company, you'd be hoping this isn't the case so that you could potentially pick up some stock while it's out of favour.
Want the full picture on earnings, revenue and cash flow for the company? Then our free report on Daiichi CommoditiesLtd will help you shine a light on its historical performance.Is There Any Revenue Growth Forecasted For Daiichi CommoditiesLtd?
There's an inherent assumption that a company should underperform the industry for P/S ratios like Daiichi CommoditiesLtd's to be considered reasonable.
Retrospectively, the last year delivered a frustrating 7.1% decrease to the company's top line. Spectacularly, three year revenue growth has ballooned by several orders of magnitude, despite the drawbacks experienced in the last 12 months. So while the company has done a great job in the past, it's somewhat concerning to see revenue growth decline so harshly.
This is in contrast to the rest of the industry, which is expected to grow by 10% over the next year, materially lower than the company's recent medium-term annualised growth rates.
In light of this, it's peculiar that Daiichi CommoditiesLtd's P/S sits below the majority of other companies. It looks like most investors are not convinced the company can maintain its recent growth rates.
The Bottom Line On Daiichi CommoditiesLtd's P/S
Daiichi CommoditiesLtd's P/S has taken a dip along with its share price. Using the price-to-sales ratio alone to determine if you should sell your stock isn't sensible, however it can be a practical guide to the company's future prospects.
We're very surprised to see Daiichi CommoditiesLtd currently trading on a much lower than expected P/S since its recent three-year growth is higher than the wider industry forecast. When we see robust revenue growth that outpaces the industry, we presume that there are notable underlying risks to the company's future performance, which is exerting downward pressure on the P/S ratio. While recent revenue trends over the past medium-term suggest that the risk of a price decline is low, investors appear to perceive a likelihood of revenue fluctuations in the future.
Plus, you should also learn about these 4 warning signs we've spotted with Daiichi CommoditiesLtd (including 1 which makes us a bit uncomfortable).
If you're unsure about the strength of Daiichi CommoditiesLtd's business, why not explore our interactive list of stocks with solid business fundamentals for some other companies you may have missed.
New: AI Stock Screener & Alerts
Our new AI Stock Screener scans the market every day to uncover opportunities.
• Dividend Powerhouses (3%+ Yield)
• Undervalued Small Caps with Insider Buying
• High growth Tech and AI Companies
Or build your own from over 50 metrics.
Have feedback on this article? Concerned about the content? Get in touch with us directly. Alternatively, email editorial-team (at) simplywallst.com.
This article by Simply Wall St is general in nature. We provide commentary based on historical data and analyst forecasts only using an unbiased methodology and our articles are not intended to be financial advice. It does not constitute a recommendation to buy or sell any stock, and does not take account of your objectives, or your financial situation. We aim to bring you long-term focused analysis driven by fundamental data. Note that our analysis may not factor in the latest price-sensitive company announcements or qualitative material. Simply Wall St has no position in any stocks mentioned.
About TSE:8746
Flawless balance sheet slight.
Market Insights

Advertisement
Community Narratives
Groundbreaking therapies that could change the treatment landscape for PTSD, fibromyalgia, MS & Alzheimer’s
Fair Value US$6.20|86.9% undervalued
CM
Community Contributor
DigitalOcean Will Grow 14% by Embracing AI with Paperspace Acquisition
Fair Value US$50.00|41.7% undervalued
NE
Community Contributor
Viant Technology: A Rising AdTech Challenger in the AI-Powered CTV Market
Fair Value US$38.61|63.2% undervalued
BL
Community Contributor
Volvo will Accelerate Forward into Electric and Autonomous Leadership in Five Years
Fair Value SEK 438.80|39.7% undervalued
UN
Community Contributor