Advertisement
- Japan
- /
- Capital Markets
- /
- TSE:8601
Does Daiwa Securities Group’s Strong 2025 Rally Signal Room for More Gains?

Simply Wall St
Reviewed by Bailey Pemberton
If you are on the fence about Daiwa Securities Group, you are not alone. A quick glance at its recent share price action hints that something is brewing. In the last week alone, the stock has nudged up 1.6%, and over the past month, it has gained 4.1%. Year to date, Daiwa is up an impressive 15.4%. If you have held on over the last three years, you are looking at a stunning 138.4% return. Stretch that to five years and the gain jumps to a remarkable 241.5%.
What has been fueling this steady climb? Market watchers point to ongoing improvements in the Japanese financial sector and increased investor optimism as important reasons for Daiwa’s momentum. News of regulatory shifts and a broader appetite for Japanese equities have also played their part. These developments may have shifted risk perceptions for established companies like Daiwa. These long-term trends suggest that the company is viewed with renewed confidence in global markets.
The big question is whether Daiwa Securities Group still has room to run, especially when you consider how it stacks up on valuation checks. On a scale where six key metrics are tested for undervaluation, Daiwa scores a 4, indicating it looks attractively valued on most measures.
Of course, knowing how a stock has performed recently is just part of the puzzle. To really understand what is next, let’s explore different ways to assess Daiwa’s value. At the end of the article, we will look at an even more insightful method.
Why Daiwa Securities Group is lagging behind its peers
Approach 1: Daiwa Securities Group Excess Returns Analysis
The Excess Returns valuation model examines Daiwa Securities Group’s return on invested equity relative to its cost of equity. In simple terms, this approach focuses on how efficiently the company generates profits above its required cost, instead of just its future cash flows.
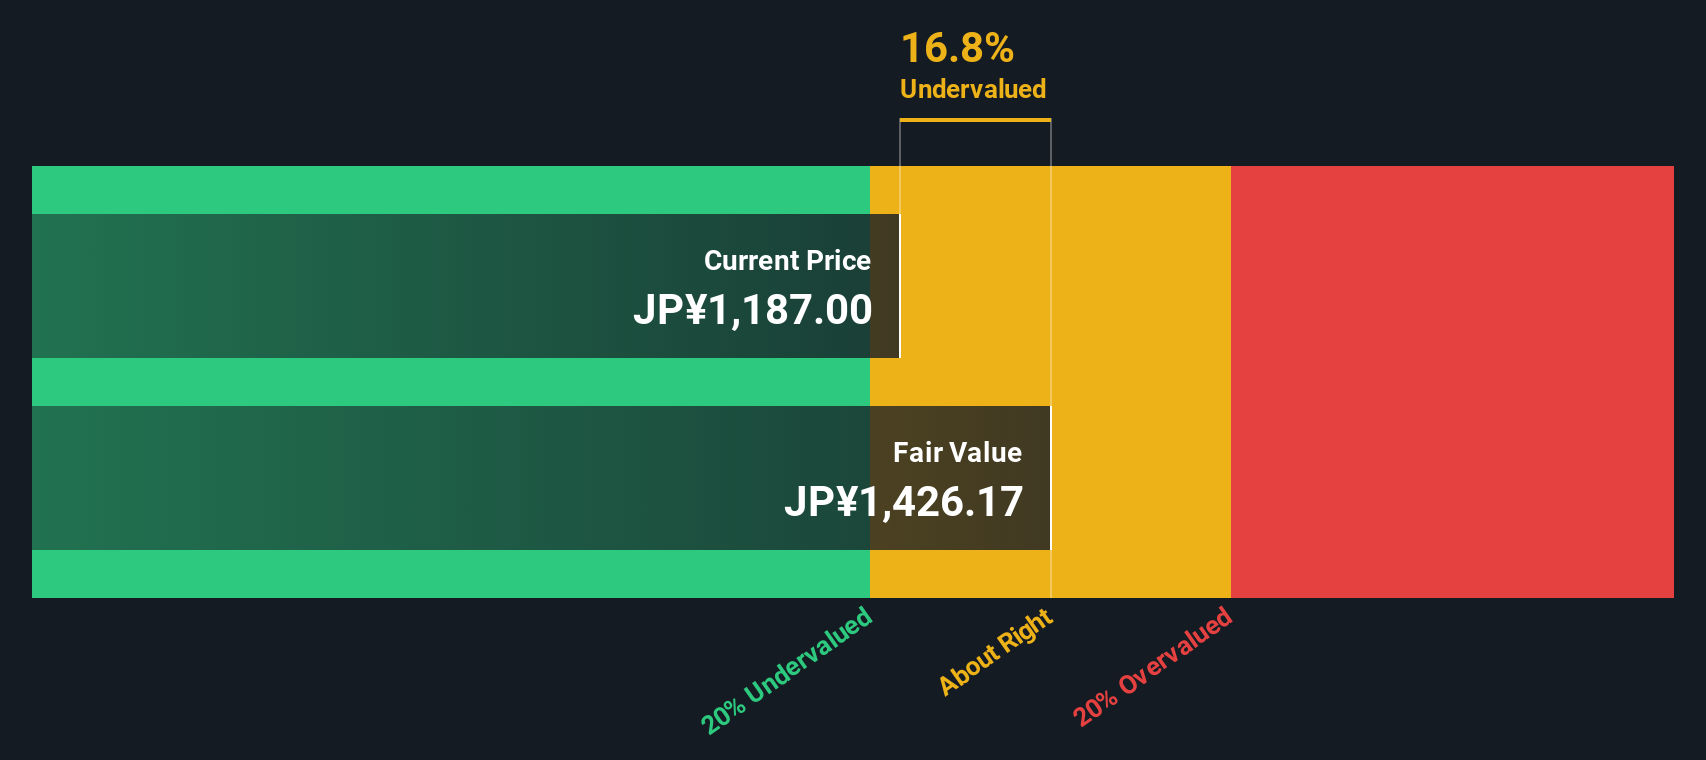
For Daiwa, the key numbers from this model are noteworthy. The company’s Book Value is ¥1,159.13 per share, and forward-looking analyst estimates place Stable EPS at ¥115.82 per share. The Cost of Equity is ¥105.61 per share, resulting in a positive Excess Return of ¥10.21 per share. This is supported by an average Return on Equity of 8.97%, with a projected Stable Book Value of ¥1,291.49 per share in the future.
In summary, the Excess Returns model estimates that Daiwa Securities Group’s intrinsic value is approximately 15.0% higher than its current share price. This suggests the stock is undervalued at present and may provide investors the opportunity to purchase below fair value.
Result: UNDERVALUED
Our Excess Returns analysis suggests Daiwa Securities Group is undervalued by 15.0%. Track this in your watchlist or portfolio, or discover more undervalued stocks.
Approach 2: Daiwa Securities Group Price vs Earnings
For profitable companies like Daiwa Securities Group, the Price-to-Earnings (PE) ratio is a time-tested and widely used metric to assess valuation. The PE ratio helps investors see how much they are paying for every ¥1 of the company’s earnings, which is especially useful when a business is consistently generating profits.
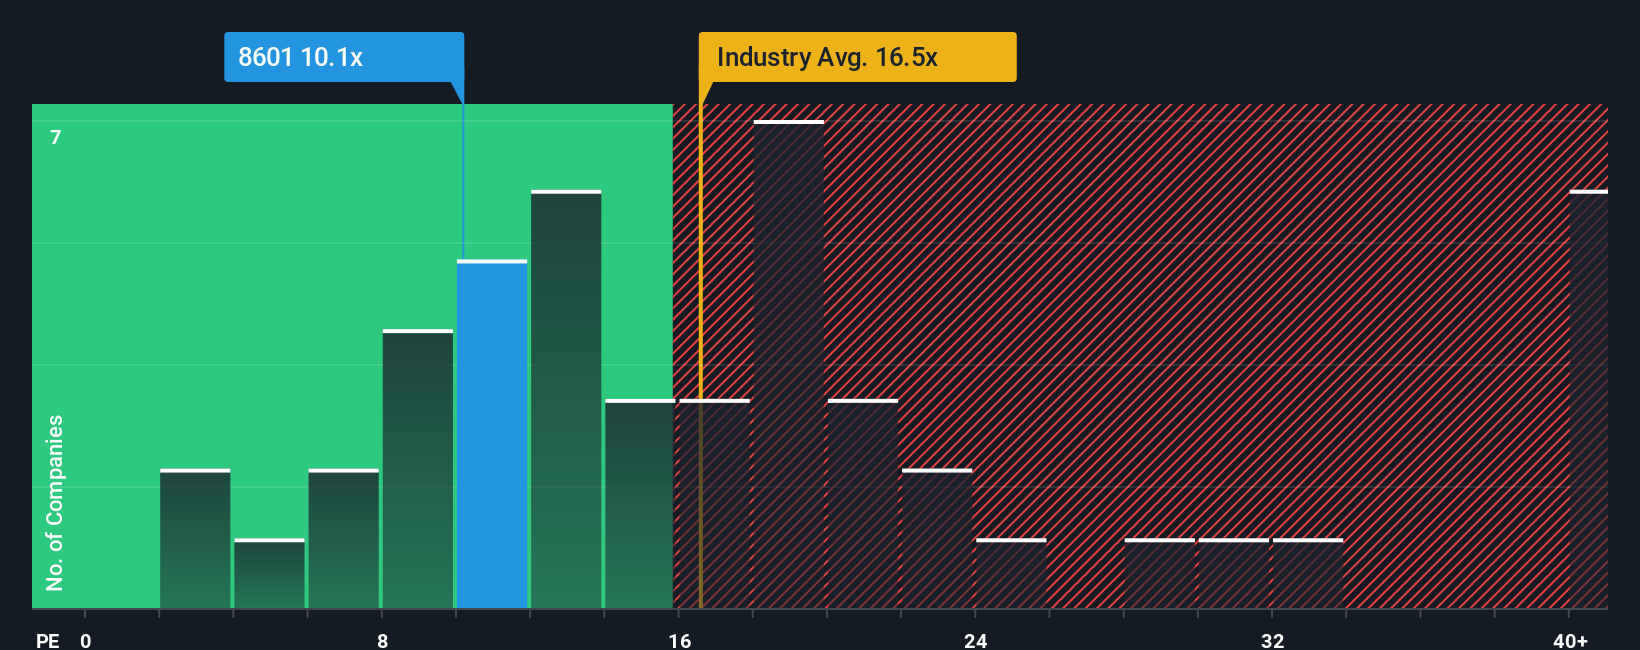
Growth expectations and risk both play a key role in determining what constitutes a “fair” PE ratio. Higher growth prospects can justify a higher PE, while greater risks typically warrant a lower ratio. As it stands, Daiwa trades at a PE ratio of 10.33x, which is noticeably below the Capital Markets industry average of 16.09x and the peer average of 14.40x.
Simply Wall St also provides a proprietary “Fair Ratio,” which for Daiwa is 17.31x. Unlike traditional benchmarks, the Fair Ratio evaluates more than just industry norms by factoring in forecasted earnings growth, risks, profit margins, company size, and sector-specific trends. This makes it a more comprehensive guide for investors than simply comparing PE ratios among peers or within the industry.
With Daiwa’s current PE of 10.33x well below its Fair Ratio of 17.31x, the stock appears undervalued based on this key metric.
Result: UNDERVALUED
PE ratios tell one story, but what if the real opportunity lies elsewhere? Discover companies where insiders are betting big on explosive growth.
Upgrade Your Decision Making: Choose your Daiwa Securities Group Narrative
Earlier, we mentioned there is an even better way to understand valuation, so let’s introduce you to Narratives. A Narrative is your personal story or perspective about a company like Daiwa Securities Group that connects the facts, such as projected fair value, future revenue, profit margins, and growth rates, to your chosen assumptions and expectations. Instead of relying only on single-point estimates or past numbers, Narratives help you weave together what you believe will drive Daiwa’s future, translating your view into a forecast and a fair value estimate.
Narratives are easy to use and accessible right now within the Community page on Simply Wall St, where millions of investors share and track their Narratives in real time. This makes it simpler for you to decide whether to buy or sell by directly comparing Fair Value from your Narrative with the current market Price.
Best of all, your Narrative updates automatically as new news or earnings are released, ensuring your view stays relevant. For Daiwa Securities Group, you might see one Narrative pointing to digital innovation, global growth, and strong wealth management driving a fair value of ¥1,350 per share, while another might focus on domestic market risks and cost pressures to estimate just ¥1,050. This demonstrates how your outlook can shape smarter investment decisions.
Do you think there's more to the story for Daiwa Securities Group? Create your own Narrative to let the Community know!
This article by Simply Wall St is general in nature. We provide commentary based on historical data and analyst forecasts only using an unbiased methodology and our articles are not intended to be financial advice. It does not constitute a recommendation to buy or sell any stock, and does not take account of your objectives, or your financial situation. We aim to bring you long-term focused analysis driven by fundamental data. Note that our analysis may not factor in the latest price-sensitive company announcements or qualitative material. Simply Wall St has no position in any stocks mentioned.
New: Manage All Your Stock Portfolios in One Place
We've created the ultimate portfolio companion for stock investors, and it's free.
• Connect an unlimited number of Portfolios and see your total in one currency
• Be alerted to new Warning Signs or Risks via email or mobile
• Track the Fair Value of your stocks
Have feedback on this article? Concerned about the content? Get in touch with us directly. Alternatively, email editorial-team@simplywallst.com
About TSE:8601
Daiwa Securities Group
Operates in the financial and capital markets in Japan and internationally.
Solid track record, good value and pays a dividend.
Similar Companies
Market Insights

Advertisement
Community Narratives
The Next Phase of Energy Storage: How NeoVolta Is Tackling America’s Power Crunch
Fair Value US$7.50|35.1% undervalued
MA
Community Contributor
Why EnSilica is Worth Possibly 13x its Current Price
Fair Value UK£5.00|89.5% undervalued
DO
Community Contributor
M&A Activity, Industry Diversification & A Defense Contract Monopoly Will Push BWXT For Healthy Long-Term Growth
Fair Value US$220.00|15.2% undervalued
CL
Community Contributor
A case for Cassiar Gold Corp (TSXV: GLDC) to reach CAD$8-10 before 2030 (X30-37)
Fair Value CA$10.00|96.0% undervalued
AG
Community Contributor