- Japan
- /
- Hospitality
- /
- TSE:8783
Positive Sentiment Still Eludes GFA Co., Ltd. (TSE:8783) Following 26% Share Price Slump

The GFA Co., Ltd. (TSE:8783) share price has softened a substantial 26% over the previous 30 days, handing back much of the gains the stock has made lately. The drop over the last 30 days has capped off a tough year for shareholders, with the share price down 38% in that time.
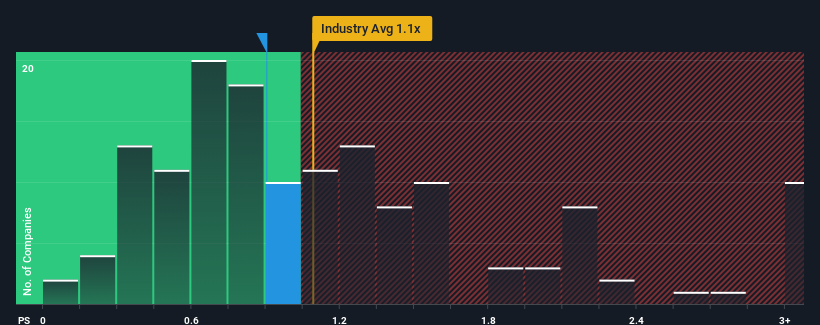
Even after such a large drop in price, there still wouldn't be many who think GFA's price-to-sales (or "P/S") ratio of 0.9x is worth a mention when the median P/S in Japan's Hospitality industry is similar at about 1.1x. However, investors might be overlooking a clear opportunity or potential setback if there is no rational basis for the P/S.
See our latest analysis for GFA
How Has GFA Performed Recently?
Recent times have been quite advantageous for GFA as its revenue has been rising very briskly. Perhaps the market is expecting future revenue performance to taper off, which has kept the P/S from rising. Those who are bullish on GFA will be hoping that this isn't the case, so that they can pick up the stock at a lower valuation.
Although there are no analyst estimates available for GFA, take a look at this free data-rich visualisation to see how the company stacks up on earnings, revenue and cash flow.What Are Revenue Growth Metrics Telling Us About The P/S?
In order to justify its P/S ratio, GFA would need to produce growth that's similar to the industry.
If we review the last year of revenue growth, the company posted a terrific increase of 146%. The latest three year period has also seen an excellent 167% overall rise in revenue, aided by its short-term performance. So we can start by confirming that the company has done a great job of growing revenue over that time.
Comparing that to the industry, which is only predicted to deliver 13% growth in the next 12 months, the company's momentum is stronger based on recent medium-term annualised revenue results.
With this information, we find it interesting that GFA is trading at a fairly similar P/S compared to the industry. It may be that most investors are not convinced the company can maintain its recent growth rates.
The Bottom Line On GFA's P/S
GFA's plummeting stock price has brought its P/S back to a similar region as the rest of the industry. Using the price-to-sales ratio alone to determine if you should sell your stock isn't sensible, however it can be a practical guide to the company's future prospects.
We've established that GFA currently trades on a lower than expected P/S since its recent three-year growth is higher than the wider industry forecast. There could be some unobserved threats to revenue preventing the P/S ratio from matching this positive performance. While recent revenue trends over the past medium-term suggest that the risk of a price decline is low, investors appear to see the likelihood of revenue fluctuations in the future.
Plus, you should also learn about these 5 warning signs we've spotted with GFA (including 4 which are concerning).
Of course, profitable companies with a history of great earnings growth are generally safer bets. So you may wish to see this free collection of other companies that have reasonable P/E ratios and have grown earnings strongly.
New: Manage All Your Stock Portfolios in One Place
We've created the ultimate portfolio companion for stock investors, and it's free.
• Connect an unlimited number of Portfolios and see your total in one currency
• Be alerted to new Warning Signs or Risks via email or mobile
• Track the Fair Value of your stocks
Have feedback on this article? Concerned about the content? Get in touch with us directly. Alternatively, email editorial-team (at) simplywallst.com.
This article by Simply Wall St is general in nature. We provide commentary based on historical data and analyst forecasts only using an unbiased methodology and our articles are not intended to be financial advice. It does not constitute a recommendation to buy or sell any stock, and does not take account of your objectives, or your financial situation. We aim to bring you long-term focused analysis driven by fundamental data. Note that our analysis may not factor in the latest price-sensitive company announcements or qualitative material. Simply Wall St has no position in any stocks mentioned.
About TSE:8783
Adequate balance sheet slight.
