- Japan
- /
- Hospitality
- /
- TSE:8783
GFA Co., Ltd.'s (TSE:8783) Stock Retreats 27% But Revenues Haven't Escaped The Attention Of Investors

To the annoyance of some shareholders, GFA Co., Ltd. (TSE:8783) shares are down a considerable 27% in the last month, which continues a horrid run for the company. Instead of being rewarded, shareholders who have already held through the last twelve months are now sitting on a 17% share price drop.
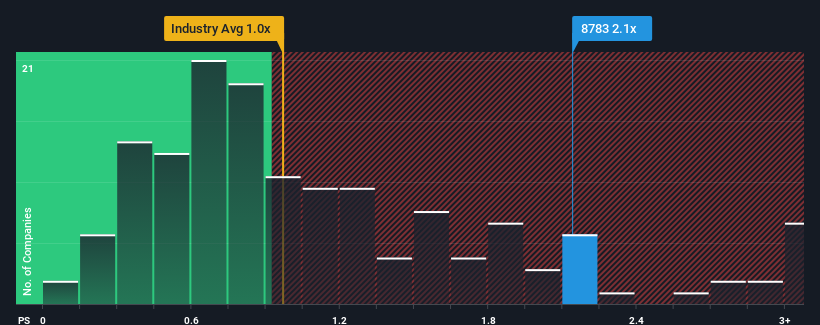
In spite of the heavy fall in price, given close to half the companies operating in Japan's Hospitality industry have price-to-sales ratios (or "P/S") below 1x, you may still consider GFA as a stock to potentially avoid with its 2.1x P/S ratio. Although, it's not wise to just take the P/S at face value as there may be an explanation why it's as high as it is.
See our latest analysis for GFA
How Has GFA Performed Recently?
For example, consider that GFA's financial performance has been poor lately as its revenue has been in decline. Perhaps the market believes the company can do enough to outperform the rest of the industry in the near future, which is keeping the P/S ratio high. You'd really hope so, otherwise you're paying a pretty hefty price for no particular reason.
Want the full picture on earnings, revenue and cash flow for the company? Then our free report on GFA will help you shine a light on its historical performance.How Is GFA's Revenue Growth Trending?
In order to justify its P/S ratio, GFA would need to produce impressive growth in excess of the industry.
Taking a look back first, the company's revenue growth last year wasn't something to get excited about as it posted a disappointing decline of 6.5%. Still, the latest three year period has seen an excellent 77% overall rise in revenue, in spite of its unsatisfying short-term performance. Although it's been a bumpy ride, it's still fair to say the revenue growth recently has been more than adequate for the company.
Comparing that recent medium-term revenue trajectory with the industry's one-year growth forecast of 9.5% shows it's noticeably more attractive.
With this information, we can see why GFA is trading at such a high P/S compared to the industry. It seems most investors are expecting this strong growth to continue and are willing to pay more for the stock.
What Does GFA's P/S Mean For Investors?
There's still some elevation in GFA's P/S, even if the same can't be said for its share price recently. Using the price-to-sales ratio alone to determine if you should sell your stock isn't sensible, however it can be a practical guide to the company's future prospects.
As we suspected, our examination of GFA revealed its three-year revenue trends are contributing to its high P/S, given they look better than current industry expectations. In the eyes of shareholders, the probability of a continued growth trajectory is great enough to prevent the P/S from pulling back. Unless the recent medium-term conditions change, they will continue to provide strong support to the share price.
Before you settle on your opinion, we've discovered 4 warning signs for GFA (3 are significant!) that you should be aware of.
If companies with solid past earnings growth is up your alley, you may wish to see this free collection of other companies with strong earnings growth and low P/E ratios.
If you're looking to trade GFA, open an account with the lowest-cost platform trusted by professionals, Interactive Brokers.
With clients in over 200 countries and territories, and access to 160 markets, IBKR lets you trade stocks, options, futures, forex, bonds and funds from a single integrated account.
Enjoy no hidden fees, no account minimums, and FX conversion rates as low as 0.03%, far better than what most brokers offer.
Sponsored ContentNew: Manage All Your Stock Portfolios in One Place
We've created the ultimate portfolio companion for stock investors, and it's free.
• Connect an unlimited number of Portfolios and see your total in one currency
• Be alerted to new Warning Signs or Risks via email or mobile
• Track the Fair Value of your stocks
Have feedback on this article? Concerned about the content? Get in touch with us directly. Alternatively, email editorial-team (at) simplywallst.com.
This article by Simply Wall St is general in nature. We provide commentary based on historical data and analyst forecasts only using an unbiased methodology and our articles are not intended to be financial advice. It does not constitute a recommendation to buy or sell any stock, and does not take account of your objectives, or your financial situation. We aim to bring you long-term focused analysis driven by fundamental data. Note that our analysis may not factor in the latest price-sensitive company announcements or qualitative material. Simply Wall St has no position in any stocks mentioned.
About TSE:8783
Adequate balance sheet slight.

