- Japan
- /
- Consumer Services
- /
- TSE:7320
Is Weakness In Solvvy Inc. (TSE:7320) Stock A Sign That The Market Could be Wrong Given Its Strong Financial Prospects?


With its stock down 10% over the past week, it is easy to disregard Solvvy (TSE:7320). However, a closer look at its sound financials might cause you to think again. Given that fundamentals usually drive long-term market outcomes, the company is worth looking at. In this article, we decided to focus on Solvvy's ROE.
Return on equity or ROE is a key measure used to assess how efficiently a company's management is utilizing the company's capital. Simply put, it is used to assess the profitability of a company in relation to its equity capital.
View our latest analysis for Solvvy
How Do You Calculate Return On Equity?
Return on equity can be calculated by using the formula:
Return on Equity = Net Profit (from continuing operations) ÷ Shareholders' Equity
So, based on the above formula, the ROE for Solvvy is:
34% = JP¥1.1b ÷ JP¥3.1b (Based on the trailing twelve months to September 2024).
The 'return' is the profit over the last twelve months. So, this means that for every ¥1 of its shareholder's investments, the company generates a profit of ¥0.34.
What Is The Relationship Between ROE And Earnings Growth?
We have already established that ROE serves as an efficient profit-generating gauge for a company's future earnings. We now need to evaluate how much profit the company reinvests or "retains" for future growth which then gives us an idea about the growth potential of the company. Assuming everything else remains unchanged, the higher the ROE and profit retention, the higher the growth rate of a company compared to companies that don't necessarily bear these characteristics.
Solvvy's Earnings Growth And 34% ROE
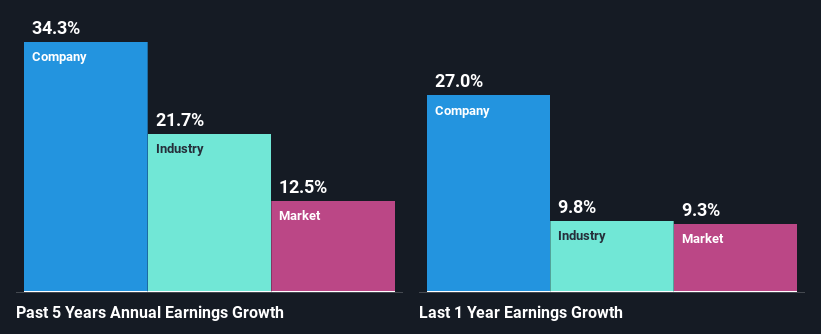
To begin with, Solvvy has a pretty high ROE which is interesting. Second, a comparison with the average ROE reported by the industry of 11% also doesn't go unnoticed by us. As a result, Solvvy's exceptional 34% net income growth seen over the past five years, doesn't come as a surprise.
Next, on comparing with the industry net income growth, we found that Solvvy's growth is quite high when compared to the industry average growth of 22% in the same period, which is great to see.
Earnings growth is a huge factor in stock valuation. It’s important for an investor to know whether the market has priced in the company's expected earnings growth (or decline). Doing so will help them establish if the stock's future looks promising or ominous. One good indicator of expected earnings growth is the P/E ratio which determines the price the market is willing to pay for a stock based on its earnings prospects. So, you may want to check if Solvvy is trading on a high P/E or a low P/E, relative to its industry.
Is Solvvy Efficiently Re-investing Its Profits?
Solvvy's three-year median payout ratio to shareholders is 8.6%, which is quite low. This implies that the company is retaining 91% of its profits. So it looks like Solvvy is reinvesting profits heavily to grow its business, which shows in its earnings growth.
Moreover, Solvvy is determined to keep sharing its profits with shareholders which we infer from its long history of six years of paying a dividend.
Summary
Overall, we are quite pleased with Solvvy's performance. Specifically, we like that the company is reinvesting a huge chunk of its profits at a high rate of return. This of course has caused the company to see substantial growth in its earnings. Having said that, the company's earnings growth is expected to slow down, as forecasted in the current analyst estimates. Are these analysts expectations based on the broad expectations for the industry, or on the company's fundamentals? Click here to be taken to our analyst's forecasts page for the company.
New: Manage All Your Stock Portfolios in One Place
We've created the ultimate portfolio companion for stock investors, and it's free.
• Connect an unlimited number of Portfolios and see your total in one currency
• Be alerted to new Warning Signs or Risks via email or mobile
• Track the Fair Value of your stocks
Have feedback on this article? Concerned about the content? Get in touch with us directly. Alternatively, email editorial-team (at) simplywallst.com.
This article by Simply Wall St is general in nature. We provide commentary based on historical data and analyst forecasts only using an unbiased methodology and our articles are not intended to be financial advice. It does not constitute a recommendation to buy or sell any stock, and does not take account of your objectives, or your financial situation. We aim to bring you long-term focused analysis driven by fundamental data. Note that our analysis may not factor in the latest price-sensitive company announcements or qualitative material. Simply Wall St has no position in any stocks mentioned.
About TSE:7320
Solvvy
Provides warranty services and software as a service (SaaS) products.
Good value with proven track record.
Market Insights

Community Narratives

