
Advertisement
- Japan
- /
- Hospitality
- /
- TSE:6819
Does The Market Have A Low Tolerance For Izu Shaboten Resort Co.,Ltd's (TSE:6819) Mixed Fundamentals?

With its stock down 14% over the past three months, it is easy to disregard Izu Shaboten ResortLtd (TSE:6819). It seems that the market might have completely ignored the positive aspects of the company's fundamentals and decided to weigh-in more on the negative aspects. Fundamentals usually dictate market outcomes so it makes sense to study the company's financials. Specifically, we decided to study Izu Shaboten ResortLtd's ROE in this article.
Return on equity or ROE is a key measure used to assess how efficiently a company's management is utilizing the company's capital. Simply put, it is used to assess the profitability of a company in relation to its equity capital.
See our latest analysis for Izu Shaboten ResortLtd
How To Calculate Return On Equity?
Return on equity can be calculated by using the formula:
Return on Equity = Net Profit (from continuing operations) ÷ Shareholders' Equity
So, based on the above formula, the ROE for Izu Shaboten ResortLtd is:
6.5% = JP¥323m ÷ JP¥4.9b (Based on the trailing twelve months to March 2024).
The 'return' refers to a company's earnings over the last year. That means that for every ¥1 worth of shareholders' equity, the company generated ¥0.07 in profit.
Why Is ROE Important For Earnings Growth?
So far, we've learned that ROE is a measure of a company's profitability. Based on how much of its profits the company chooses to reinvest or "retain", we are then able to evaluate a company's future ability to generate profits. Assuming all else is equal, companies that have both a higher return on equity and higher profit retention are usually the ones that have a higher growth rate when compared to companies that don't have the same features.
Izu Shaboten ResortLtd's Earnings Growth And 6.5% ROE
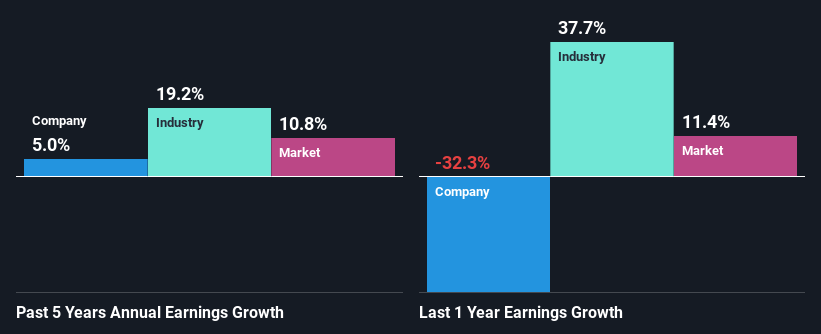
On the face of it, Izu Shaboten ResortLtd's ROE is not much to talk about. We then compared the company's ROE to the broader industry and were disappointed to see that the ROE is lower than the industry average of 12%. Izu Shaboten ResortLtd was still able to see a decent net income growth of 5.0% over the past five years. So, there might be other aspects that are positively influencing the company's earnings growth. For instance, the company has a low payout ratio or is being managed efficiently.
We then compared Izu Shaboten ResortLtd's net income growth with the industry and found that the company's growth figure is lower than the average industry growth rate of 19% in the same 5-year period, which is a bit concerning.
Earnings growth is an important metric to consider when valuing a stock. It’s important for an investor to know whether the market has priced in the company's expected earnings growth (or decline). By doing so, they will have an idea if the stock is headed into clear blue waters or if swampy waters await. If you're wondering about Izu Shaboten ResortLtd's's valuation, check out this gauge of its price-to-earnings ratio, as compared to its industry.
Is Izu Shaboten ResortLtd Efficiently Re-investing Its Profits?
Izu Shaboten ResortLtd has a significant three-year median payout ratio of 56%, meaning that it is left with only 44% to reinvest into its business. This implies that the company has been able to achieve decent earnings growth despite returning most of its profits to shareholders.
Summary
Overall, we have mixed feelings about Izu Shaboten ResortLtd. Although the company has shown a fair bit of growth in earnings, the reinvestment rate is low. Meaning, the earnings growth number could have been significantly higher had the company been retaining more of its profits and reinvesting that at a higher rate of return. Up till now, we've only made a short study of the company's growth data. To gain further insights into Izu Shaboten ResortLtd's past profit growth, check out this visualization of past earnings, revenue and cash flows.
New: AI Stock Screener & Alerts
Our new AI Stock Screener scans the market every day to uncover opportunities.
• Dividend Powerhouses (3%+ Yield)
• Undervalued Small Caps with Insider Buying
• High growth Tech and AI Companies
Or build your own from over 50 metrics.
Have feedback on this article? Concerned about the content? Get in touch with us directly. Alternatively, email editorial-team (at) simplywallst.com.
This article by Simply Wall St is general in nature. We provide commentary based on historical data and analyst forecasts only using an unbiased methodology and our articles are not intended to be financial advice. It does not constitute a recommendation to buy or sell any stock, and does not take account of your objectives, or your financial situation. We aim to bring you long-term focused analysis driven by fundamental data. Note that our analysis may not factor in the latest price-sensitive company announcements or qualitative material. Simply Wall St has no position in any stocks mentioned.
Have feedback on this article? Concerned about the content? Get in touch with us directly. Alternatively, email editorial-team@simplywallst.com
About TSE:6819
Solid track record with excellent balance sheet.
Market Insights


Advertisement
Community Narratives
For the Emperor: Why Games Workshop Could Be a Star Investment
Fair Value UK£160.00|0.4% overvalued
RO
Community Contributor
Securitas will boost margins with AI and tech-driven services
Fair Value SEK 260.91|44.5% undervalued
UN
Community Contributor
A Leader in EV Charging with Growth Potential
Fair Value €27.00|17.8% undervalued
TI
Community Contributor