- Japan
- /
- Consumer Services
- /
- TSE:4487
Slammed 30% Spacemarket,Inc. (TSE:4487) Screens Well Here But There Might Be A Catch


Spacemarket,Inc. (TSE:4487) shareholders that were waiting for something to happen have been dealt a blow with a 30% share price drop in the last month. The drop over the last 30 days has capped off a tough year for shareholders, with the share price down 34% in that time.
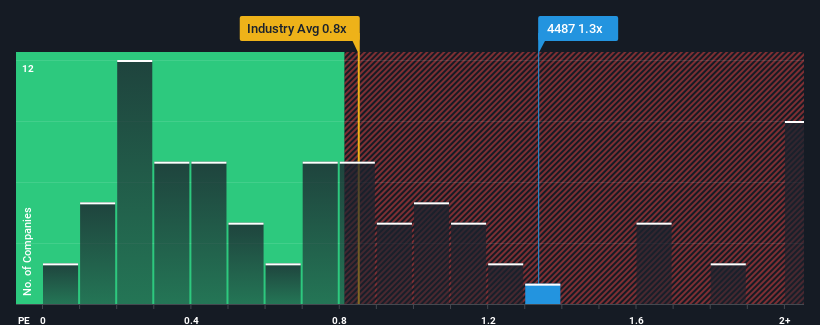
In spite of the heavy fall in price, there still wouldn't be many who think SpacemarketInc's price-to-sales (or "P/S") ratio of 1.3x is worth a mention when the median P/S in Japan's Consumer Services industry is similar at about 0.8x. While this might not raise any eyebrows, if the P/S ratio is not justified investors could be missing out on a potential opportunity or ignoring looming disappointment.
Check out our latest analysis for SpacemarketInc
How SpacemarketInc Has Been Performing
Revenue has risen firmly for SpacemarketInc recently, which is pleasing to see. One possibility is that the P/S is moderate because investors think this respectable revenue growth might not be enough to outperform the broader industry in the near future. Those who are bullish on SpacemarketInc will be hoping that this isn't the case, so that they can pick up the stock at a lower valuation.
Want the full picture on earnings, revenue and cash flow for the company? Then our free report on SpacemarketInc will help you shine a light on its historical performance.How Is SpacemarketInc's Revenue Growth Trending?
There's an inherent assumption that a company should be matching the industry for P/S ratios like SpacemarketInc's to be considered reasonable.
Taking a look back first, we see that the company grew revenue by an impressive 26% last year. The latest three year period has also seen an excellent 60% overall rise in revenue, aided by its short-term performance. Accordingly, shareholders would have definitely welcomed those medium-term rates of revenue growth.
This is in contrast to the rest of the industry, which is expected to grow by 12% over the next year, materially lower than the company's recent medium-term annualised growth rates.
With this information, we find it interesting that SpacemarketInc is trading at a fairly similar P/S compared to the industry. Apparently some shareholders believe the recent performance is at its limits and have been accepting lower selling prices.
What Does SpacemarketInc's P/S Mean For Investors?
With its share price dropping off a cliff, the P/S for SpacemarketInc looks to be in line with the rest of the Consumer Services industry. While the price-to-sales ratio shouldn't be the defining factor in whether you buy a stock or not, it's quite a capable barometer of revenue expectations.
We've established that SpacemarketInc currently trades on a lower than expected P/S since its recent three-year growth is higher than the wider industry forecast. When we see strong revenue with faster-than-industry growth, we can only assume potential risks are what might be placing pressure on the P/S ratio. While recent revenue trends over the past medium-term suggest that the risk of a price decline is low, investors appear to see the likelihood of revenue fluctuations in the future.
Plus, you should also learn about these 2 warning signs we've spotted with SpacemarketInc .
It's important to make sure you look for a great company, not just the first idea you come across. So if growing profitability aligns with your idea of a great company, take a peek at this free list of interesting companies with strong recent earnings growth (and a low P/E).
If you're looking to trade SpacemarketInc, open an account with the lowest-cost platform trusted by professionals, Interactive Brokers.
With clients in over 200 countries and territories, and access to 160 markets, IBKR lets you trade stocks, options, futures, forex, bonds and funds from a single integrated account.
Enjoy no hidden fees, no account minimums, and FX conversion rates as low as 0.03%, far better than what most brokers offer.
Sponsored ContentNew: Manage All Your Stock Portfolios in One Place
We've created the ultimate portfolio companion for stock investors, and it's free.
• Connect an unlimited number of Portfolios and see your total in one currency
• Be alerted to new Warning Signs or Risks via email or mobile
• Track the Fair Value of your stocks
Have feedback on this article? Concerned about the content? Get in touch with us directly. Alternatively, email editorial-team (at) simplywallst.com.
This article by Simply Wall St is general in nature. We provide commentary based on historical data and analyst forecasts only using an unbiased methodology and our articles are not intended to be financial advice. It does not constitute a recommendation to buy or sell any stock, and does not take account of your objectives, or your financial situation. We aim to bring you long-term focused analysis driven by fundamental data. Note that our analysis may not factor in the latest price-sensitive company announcements or qualitative material. Simply Wall St has no position in any stocks mentioned.
About TSE:4487
Excellent balance sheet with proven track record.
Market Insights

Community Narratives


