
Advertisement

Some say volatility, rather than debt, is the best way to think about risk as an investor, but Warren Buffett famously said that 'Volatility is far from synonymous with risk.' When we think about how risky a company is, we always like to look at its use of debt, since debt overload can lead to ruin. As with many other companies Spacemarket,Inc. (TSE:4487) makes use of debt. But is this debt a concern to shareholders?
Why Does Debt Bring Risk?
Debt and other liabilities become risky for a business when it cannot easily fulfill those obligations, either with free cash flow or by raising capital at an attractive price. If things get really bad, the lenders can take control of the business. However, a more usual (but still expensive) situation is where a company must dilute shareholders at a cheap share price simply to get debt under control. Of course, plenty of companies use debt to fund growth, without any negative consequences. The first thing to do when considering how much debt a business uses is to look at its cash and debt together.
How Much Debt Does SpacemarketInc Carry?
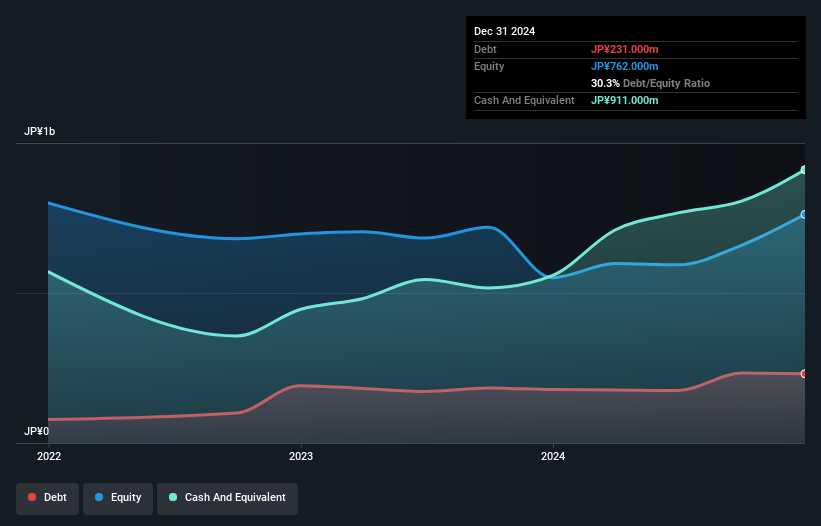
You can click the graphic below for the historical numbers, but it shows that as of December 2024 SpacemarketInc had JP¥231.0m of debt, an increase on JP¥178.0m, over one year. But it also has JP¥911.0m in cash to offset that, meaning it has JP¥680.0m net cash.
How Strong Is SpacemarketInc's Balance Sheet?
The latest balance sheet data shows that SpacemarketInc had liabilities of JP¥1.70b due within a year, and liabilities of JP¥73.0m falling due after that. Offsetting this, it had JP¥911.0m in cash and JP¥1.17b in receivables that were due within 12 months. So it actually has JP¥308.0m more liquid assets than total liabilities.
This short term liquidity is a sign that SpacemarketInc could probably pay off its debt with ease, as its balance sheet is far from stretched. Simply put, the fact that SpacemarketInc has more cash than debt is arguably a good indication that it can manage its debt safely.
See our latest analysis for SpacemarketInc
In addition to that, we're happy to report that SpacemarketInc has boosted its EBIT by 74%, thus reducing the spectre of future debt repayments. When analysing debt levels, the balance sheet is the obvious place to start. But you can't view debt in total isolation; since SpacemarketInc will need earnings to service that debt. So when considering debt, it's definitely worth looking at the earnings trend. Click here for an interactive snapshot.
Finally, a business needs free cash flow to pay off debt; accounting profits just don't cut it. While SpacemarketInc has net cash on its balance sheet, it's still worth taking a look at its ability to convert earnings before interest and tax (EBIT) to free cash flow, to help us understand how quickly it is building (or eroding) that cash balance. Happily for any shareholders, SpacemarketInc actually produced more free cash flow than EBIT over the last two years. There's nothing better than incoming cash when it comes to staying in your lenders' good graces.
Summing Up
While we empathize with investors who find debt concerning, you should keep in mind that SpacemarketInc has net cash of JP¥680.0m, as well as more liquid assets than liabilities. And it impressed us with free cash flow of JP¥300m, being 170% of its EBIT. So is SpacemarketInc's debt a risk? It doesn't seem so to us. The balance sheet is clearly the area to focus on when you are analysing debt. However, not all investment risk resides within the balance sheet - far from it. These risks can be hard to spot. Every company has them, and we've spotted 2 warning signs for SpacemarketInc you should know about.
At the end of the day, it's often better to focus on companies that are free from net debt. You can access our special list of such companies (all with a track record of profit growth). It's free.
New: Manage All Your Stock Portfolios in One Place
We've created the ultimate portfolio companion for stock investors, and it's free.
• Connect an unlimited number of Portfolios and see your total in one currency
• Be alerted to new Warning Signs or Risks via email or mobile
• Track the Fair Value of your stocks
Have feedback on this article? Concerned about the content? Get in touch with us directly. Alternatively, email editorial-team (at) simplywallst.com.
This article by Simply Wall St is general in nature. We provide commentary based on historical data and analyst forecasts only using an unbiased methodology and our articles are not intended to be financial advice. It does not constitute a recommendation to buy or sell any stock, and does not take account of your objectives, or your financial situation. We aim to bring you long-term focused analysis driven by fundamental data. Note that our analysis may not factor in the latest price-sensitive company announcements or qualitative material. Simply Wall St has no position in any stocks mentioned.
About TSE:4487
Excellent balance sheet with proven track record.
Market Insights

Advertisement
Community Narratives

Apple: A Dying Star with an Overpriced Valuation
Fair Value US$177.34|19.7% overvalued
IN
Community Contributor
Avino a case for USD$20 per share within 5 years (assuming $3,500 gold, $100 silver and $4 copper).
Fair Value CA$26.79|87.9% undervalued
AG
Community Contributor
Riding the Defense Boom RENK Sees Revenue Climb at 15% CAGR by FY 2029
Fair Value €69.87|24.5% undervalued
CH
Community Contributor