
Advertisement
Some say volatility, rather than debt, is the best way to think about risk as an investor, but Warren Buffett famously said that 'Volatility is far from synonymous with risk.' It's only natural to consider a company's balance sheet when you examine how risky it is, since debt is often involved when a business collapses. We note that WDI Corporation (TYO:3068) does have debt on its balance sheet. But should shareholders be worried about its use of debt?
When Is Debt Dangerous?
Debt assists a business until the business has trouble paying it off, either with new capital or with free cash flow. If things get really bad, the lenders can take control of the business. However, a more common (but still painful) scenario is that it has to raise new equity capital at a low price, thus permanently diluting shareholders. By replacing dilution, though, debt can be an extremely good tool for businesses that need capital to invest in growth at high rates of return. The first step when considering a company's debt levels is to consider its cash and debt together.
See our latest analysis for WDI
What Is WDI's Debt?
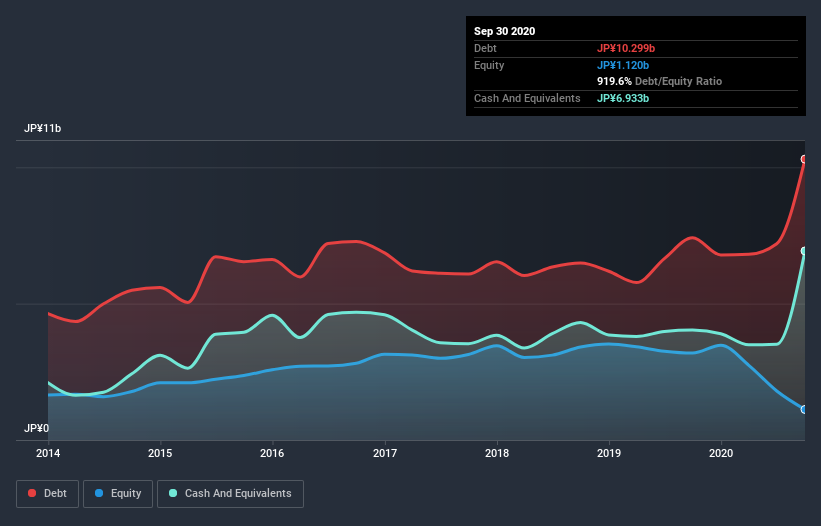
You can click the graphic below for the historical numbers, but it shows that as of September 2020 WDI had JP¥10.3b of debt, an increase on JP¥7.42b, over one year. However, it also had JP¥6.93b in cash, and so its net debt is JP¥3.37b.
How Healthy Is WDI's Balance Sheet?
Zooming in on the latest balance sheet data, we can see that WDI had liabilities of JP¥7.94b due within 12 months and liabilities of JP¥6.31b due beyond that. Offsetting these obligations, it had cash of JP¥6.93b as well as receivables valued at JP¥453.0m due within 12 months. So its liabilities outweigh the sum of its cash and (near-term) receivables by JP¥6.87b.
This is a mountain of leverage relative to its market capitalization of JP¥9.22b. This suggests shareholders would be heavily diluted if the company needed to shore up its balance sheet in a hurry. The balance sheet is clearly the area to focus on when you are analysing debt. But you can't view debt in total isolation; since WDI will need earnings to service that debt. So when considering debt, it's definitely worth looking at the earnings trend. Click here for an interactive snapshot.
Over 12 months, WDI made a loss at the EBIT level, and saw its revenue drop to JP¥22b, which is a fall of 27%. To be frank that doesn't bode well.
Caveat Emptor
While WDI's falling revenue is about as heartwarming as a wet blanket, arguably its earnings before interest and tax (EBIT) loss is even less appealing. Indeed, it lost JP¥709m at the EBIT level. Considering that alongside the liabilities mentioned above does not give us much confidence that company should be using so much debt. Quite frankly we think the balance sheet is far from match-fit, although it could be improved with time. We would feel better if it turned its trailing twelve month loss of JP¥2.1b into a profit. So to be blunt we do think it is risky. When analysing debt levels, the balance sheet is the obvious place to start. But ultimately, every company can contain risks that exist outside of the balance sheet. Like risks, for instance. Every company has them, and we've spotted 3 warning signs for WDI (of which 2 are a bit unpleasant!) you should know about.
If, after all that, you're more interested in a fast growing company with a rock-solid balance sheet, then check out our list of net cash growth stocks without delay.
If you’re looking to trade WDI, open an account with the lowest-cost* platform trusted by professionals, Interactive Brokers. Their clients from over 200 countries and territories trade stocks, options, futures, forex, bonds and funds worldwide from a single integrated account. Promoted
Valuation is complex, but we're here to simplify it.
Discover if WDI might be undervalued or overvalued with our detailed analysis, featuring fair value estimates, potential risks, dividends, insider trades, and its financial condition.
Access Free AnalysisThis article by Simply Wall St is general in nature. It does not constitute a recommendation to buy or sell any stock, and does not take account of your objectives, or your financial situation. We aim to bring you long-term focused analysis driven by fundamental data. Note that our analysis may not factor in the latest price-sensitive company announcements or qualitative material. Simply Wall St has no position in any stocks mentioned.
*Interactive Brokers Rated Lowest Cost Broker by StockBrokers.com Annual Online Review 2020
Have feedback on this article? Concerned about the content? Get in touch with us directly. Alternatively, email editorial-team (at) simplywallst.com.
About TSE:3068
Adequate balance sheet with questionable track record.
Market Insights

Advertisement
Community Narratives
A formidable player in AI and enterprise computing.
Fair Value US$210.00|3.0% undervalued
CO
Community Contributor
IREN's Bold Moves in Sustainable Bitcoin Mining & AI Data Centers
Fair Value US$72.52|20.4% undervalued
BL
Community Contributor
Cooling the Champions: The Aussie Tech Behind F1's Victories
Fair Value AU$12.40|36.8% undervalued
TR
Community Contributor