- Japan
- /
- Food and Staples Retail
- /
- TSE:5856
Investors Appear Satisfied With Life Intelligent Enterprise Holdings Co.,Ltd.'s (TSE:5856) Prospects As Shares Rocket 35%


Life Intelligent Enterprise Holdings Co.,Ltd. (TSE:5856) shareholders have had their patience rewarded with a 35% share price jump in the last month. But the gains over the last month weren't enough to make shareholders whole, as the share price is still down 6.5% in the last twelve months.
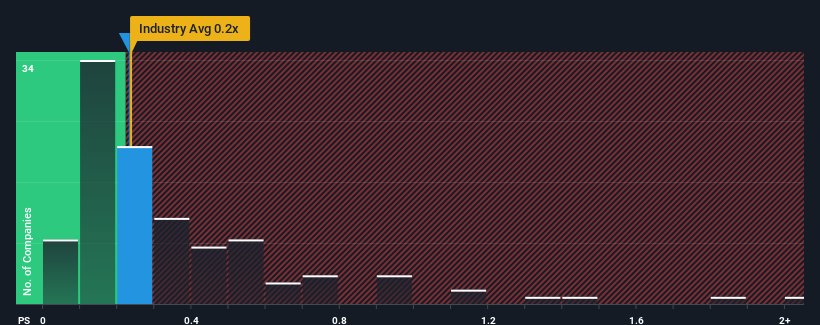
In spite of the firm bounce in price, you could still be forgiven for feeling indifferent about Life Intelligent Enterprise HoldingsLtd's P/S ratio of 0.2x, since the median price-to-sales (or "P/S") ratio for the Consumer Retailing industry in Japan is about the same. While this might not raise any eyebrows, if the P/S ratio is not justified investors could be missing out on a potential opportunity or ignoring looming disappointment.
View our latest analysis for Life Intelligent Enterprise HoldingsLtd
What Does Life Intelligent Enterprise HoldingsLtd's Recent Performance Look Like?
Life Intelligent Enterprise HoldingsLtd has been doing a good job lately as it's been growing revenue at a solid pace. Perhaps the market is expecting future revenue performance to only keep up with the broader industry, which has keeping the P/S in line with expectations. If that doesn't eventuate, then existing shareholders probably aren't too pessimistic about the future direction of the share price.
Although there are no analyst estimates available for Life Intelligent Enterprise HoldingsLtd, take a look at this free data-rich visualisation to see how the company stacks up on earnings, revenue and cash flow.How Is Life Intelligent Enterprise HoldingsLtd's Revenue Growth Trending?
In order to justify its P/S ratio, Life Intelligent Enterprise HoldingsLtd would need to produce growth that's similar to the industry.
Retrospectively, the last year delivered a decent 8.8% gain to the company's revenues. The latest three year period has also seen a 17% overall rise in revenue, aided somewhat by its short-term performance. Accordingly, shareholders would have probably been satisfied with the medium-term rates of revenue growth.
Comparing that to the industry, which is predicted to deliver 3.6% growth in the next 12 months, the company's momentum is pretty similar based on recent medium-term annualised revenue results.
With this in consideration, it's clear to see why Life Intelligent Enterprise HoldingsLtd's P/S matches up closely to its industry peers. Apparently shareholders are comfortable to simply hold on assuming the company will continue keeping a low profile.
What Does Life Intelligent Enterprise HoldingsLtd's P/S Mean For Investors?
Its shares have lifted substantially and now Life Intelligent Enterprise HoldingsLtd's P/S is back within range of the industry median. While the price-to-sales ratio shouldn't be the defining factor in whether you buy a stock or not, it's quite a capable barometer of revenue expectations.
It appears to us that Life Intelligent Enterprise HoldingsLtd maintains its moderate P/S off the back of its recent three-year growth being in line with the wider industry forecast. Right now shareholders are comfortable with the P/S as they are quite confident future revenue won't throw up any surprises. If recent medium-term revenue trends continue, it's hard to see the share price moving strongly in either direction in the near future under these circumstances.
Before you take the next step, you should know about the 3 warning signs for Life Intelligent Enterprise HoldingsLtd (1 can't be ignored!) that we have uncovered.
Of course, profitable companies with a history of great earnings growth are generally safer bets. So you may wish to see this free collection of other companies that have reasonable P/E ratios and have grown earnings strongly.
If you're looking to trade Life Intelligent Enterprise HoldingsLtd, open an account with the lowest-cost platform trusted by professionals, Interactive Brokers.
With clients in over 200 countries and territories, and access to 160 markets, IBKR lets you trade stocks, options, futures, forex, bonds and funds from a single integrated account.
Enjoy no hidden fees, no account minimums, and FX conversion rates as low as 0.03%, far better than what most brokers offer.
Sponsored ContentNew: AI Stock Screener & Alerts
Our new AI Stock Screener scans the market every day to uncover opportunities.
• Dividend Powerhouses (3%+ Yield)
• Undervalued Small Caps with Insider Buying
• High growth Tech and AI Companies
Or build your own from over 50 metrics.
Have feedback on this article? Concerned about the content? Get in touch with us directly. Alternatively, email editorial-team (at) simplywallst.com.
This article by Simply Wall St is general in nature. We provide commentary based on historical data and analyst forecasts only using an unbiased methodology and our articles are not intended to be financial advice. It does not constitute a recommendation to buy or sell any stock, and does not take account of your objectives, or your financial situation. We aim to bring you long-term focused analysis driven by fundamental data. Note that our analysis may not factor in the latest price-sensitive company announcements or qualitative material. Simply Wall St has no position in any stocks mentioned.
About TSE:5856
Life Intelligent Enterprise HoldingsLtd
Life Intelligent Enterprise Holdings Co.,Ltd.
Slight with mediocre balance sheet.
Market Insights

Community Narratives

