
Advertisement
- Japan
- /
- Food and Staples Retail
- /
- TSE:3539
Here's What We Like About JM HoldingsLtd's (TSE:3539) Upcoming Dividend

JM Holdings Co.,Ltd. (TSE:3539) is about to trade ex-dividend in the next 4 days. The ex-dividend date generally occurs two days before the record date, which is the day on which shareholders need to be on the company's books in order to receive a dividend. The ex-dividend date is important as the process of settlement involves at least two full business days. So if you miss that date, you would not show up on the company's books on the record date. Meaning, you will need to purchase JM HoldingsLtd's shares before the 30th of July to receive the dividend, which will be paid on the 29th of October.
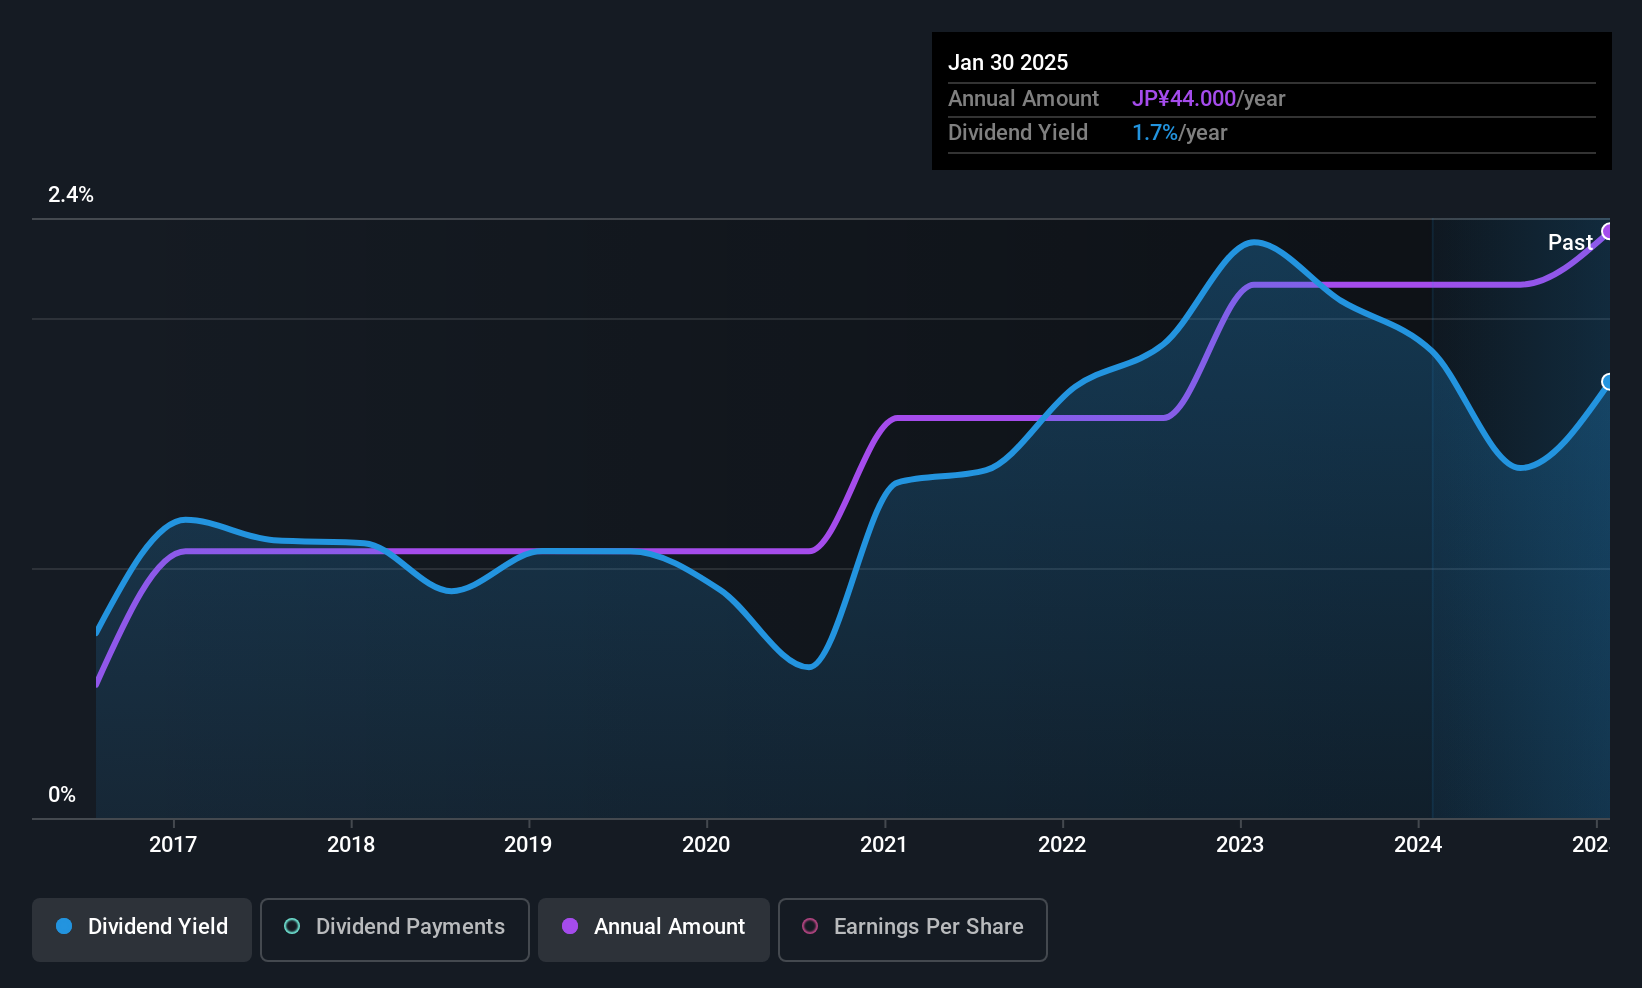
The company's upcoming dividend is JP¥22.00 a share, following on from the last 12 months, when the company distributed a total of JP¥44.00 per share to shareholders. Calculating the last year's worth of payments shows that JM HoldingsLtd has a trailing yield of 1.6% on the current share price of JP¥2775.00. Dividends are an important source of income to many shareholders, but the health of the business is crucial to maintaining those dividends. We need to see whether the dividend is covered by earnings and if it's growing.
Dividends are typically paid from company earnings. If a company pays more in dividends than it earned in profit, then the dividend could be unsustainable. JM HoldingsLtd is paying out just 20% of its profit after tax, which is comfortably low and leaves plenty of breathing room in the case of adverse events. A useful secondary check can be to evaluate whether JM HoldingsLtd generated enough free cash flow to afford its dividend. It distributed 47% of its free cash flow as dividends, a comfortable payout level for most companies.
It's positive to see that JM HoldingsLtd's dividend is covered by both profits and cash flow, since this is generally a sign that the dividend is sustainable, and a lower payout ratio usually suggests a greater margin of safety before the dividend gets cut.
View our latest analysis for JM HoldingsLtd
Click here to see how much of its profit JM HoldingsLtd paid out over the last 12 months.
Have Earnings And Dividends Been Growing?
Businesses with strong growth prospects usually make the best dividend payers, because it's easier to grow dividends when earnings per share are improving. Investors love dividends, so if earnings fall and the dividend is reduced, expect a stock to be sold off heavily at the same time. Fortunately for readers, JM HoldingsLtd's earnings per share have been growing at 17% a year for the past five years. The company has managed to grow earnings at a rapid rate, while reinvesting most of the profits within the business. Fast-growing businesses that are reinvesting heavily are enticing from a dividend perspective, especially since they can often increase the payout ratio later.
The main way most investors will assess a company's dividend prospects is by checking the historical rate of dividend growth. Since the start of our data, nine years ago, JM HoldingsLtd has lifted its dividend by approximately 18% a year on average. It's great to see earnings per share growing rapidly over several years, and dividends per share growing right along with it.
Final Takeaway
Should investors buy JM HoldingsLtd for the upcoming dividend? JM HoldingsLtd has been growing earnings at a rapid rate, and has a conservatively low payout ratio, implying that it is reinvesting heavily in its business; a sterling combination. JM HoldingsLtd looks solid on this analysis overall, and we'd definitely consider investigating it more closely.
Curious about whether JM HoldingsLtd has been able to consistently generate growth? Here's a chart of its historical revenue and earnings growth.
A common investing mistake is buying the first interesting stock you see. Here you can find a full list of high-yield dividend stocks.
New: Manage All Your Stock Portfolios in One Place
We've created the ultimate portfolio companion for stock investors, and it's free.
• Connect an unlimited number of Portfolios and see your total in one currency
• Be alerted to new Warning Signs or Risks via email or mobile
• Track the Fair Value of your stocks
Have feedback on this article? Concerned about the content? Get in touch with us directly. Alternatively, email editorial-team (at) simplywallst.com.
This article by Simply Wall St is general in nature. We provide commentary based on historical data and analyst forecasts only using an unbiased methodology and our articles are not intended to be financial advice. It does not constitute a recommendation to buy or sell any stock, and does not take account of your objectives, or your financial situation. We aim to bring you long-term focused analysis driven by fundamental data. Note that our analysis may not factor in the latest price-sensitive company announcements or qualitative material. Simply Wall St has no position in any stocks mentioned.
About TSE:3539
Flawless balance sheet with solid track record.
Market Insights


Advertisement
Community Narratives
Pole position to benefit from GENIUS Act
Fair Value US$233.04|59.1% undervalued
CH
Community Contributor
IREN will transform from bitcoin miner to leader in AI infrastructure
Fair Value US$21.48|15.5% undervalued
KA
Community Contributor
Behind the Assay: XRF Scientific’s Role in Modern Mining Economics
Fair Value AU$2.10|2.4% undervalued
RO
Community Contributor