
Advertisement
Warren Buffett famously said, 'Volatility is far from synonymous with risk.' When we think about how risky a company is, we always like to look at its use of debt, since debt overload can lead to ruin. We note that Yamaha Corporation (TSE:7951) does have debt on its balance sheet. But the more important question is: how much risk is that debt creating?
When Is Debt Dangerous?
Debt and other liabilities become risky for a business when it cannot easily fulfill those obligations, either with free cash flow or by raising capital at an attractive price. Ultimately, if the company can't fulfill its legal obligations to repay debt, shareholders could walk away with nothing. While that is not too common, we often do see indebted companies permanently diluting shareholders because lenders force them to raise capital at a distressed price. By replacing dilution, though, debt can be an extremely good tool for businesses that need capital to invest in growth at high rates of return. When we think about a company's use of debt, we first look at cash and debt together.
What Is Yamaha's Debt?
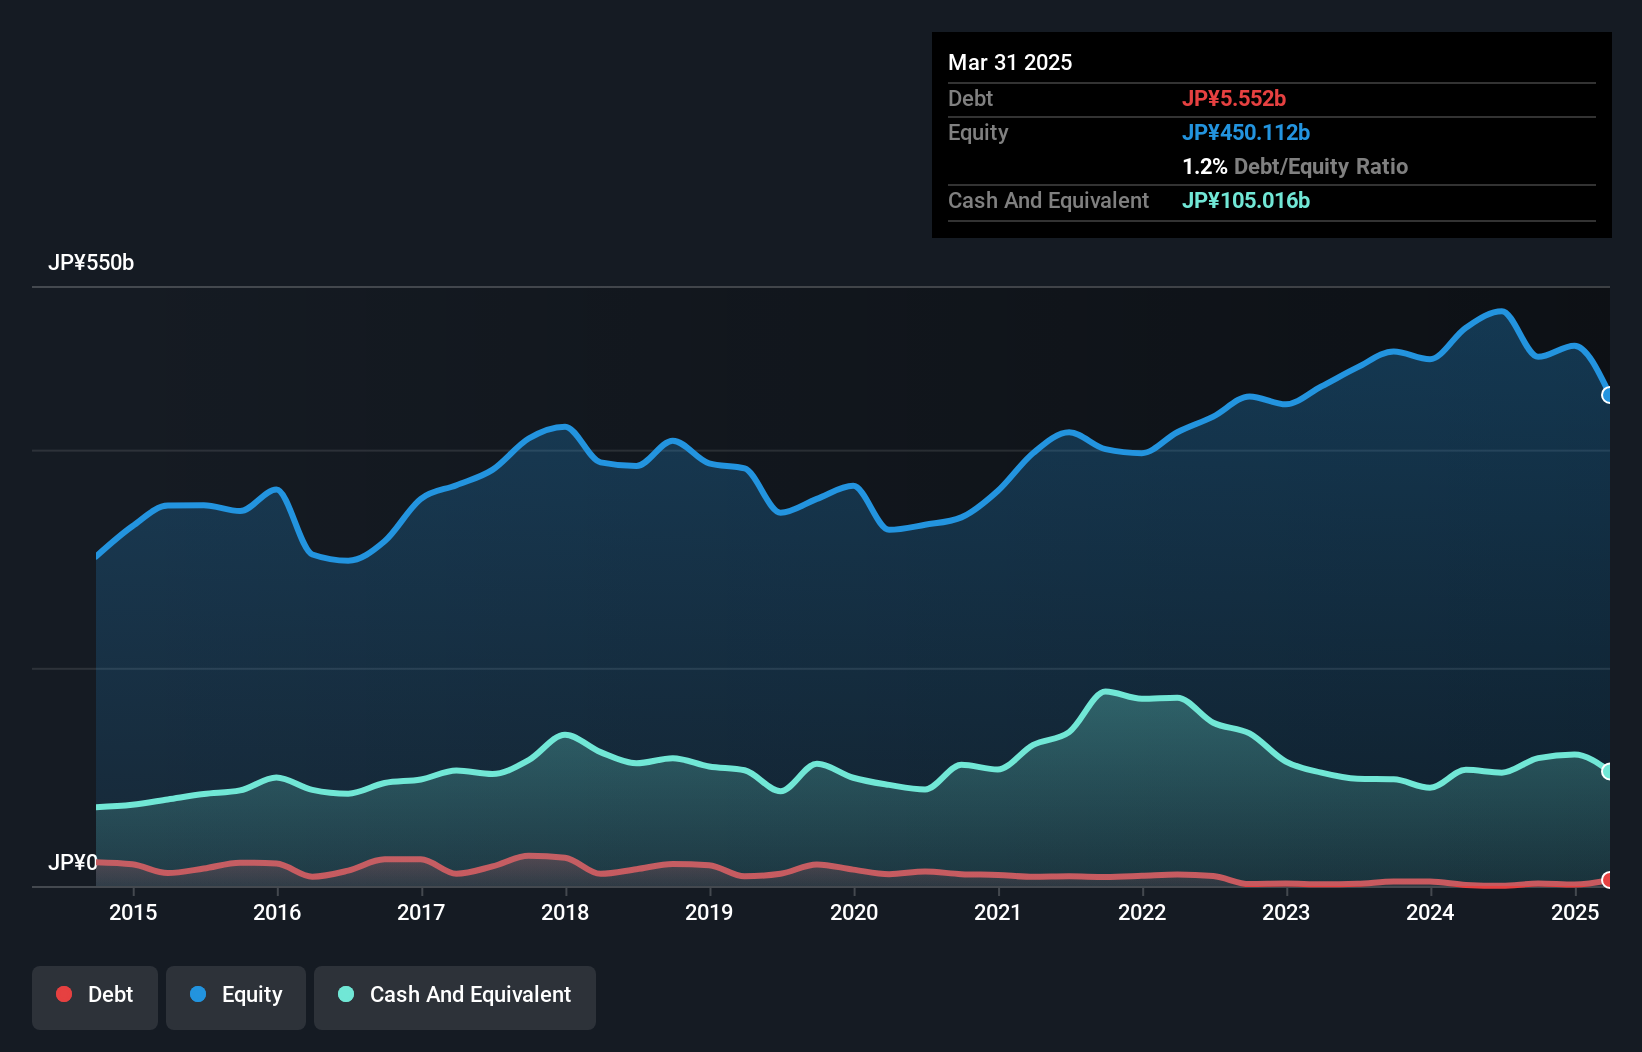
The image below, which you can click on for greater detail, shows that at March 2025 Yamaha had debt of JP¥5.55b, up from JP¥992.0m in one year. However, it does have JP¥105.0b in cash offsetting this, leading to net cash of JP¥99.5b.
A Look At Yamaha's Liabilities
The latest balance sheet data shows that Yamaha had liabilities of JP¥106.7b due within a year, and liabilities of JP¥34.5b falling due after that. Offsetting these obligations, it had cash of JP¥105.0b as well as receivables valued at JP¥89.4b due within 12 months. So it can boast JP¥53.2b more liquid assets than total liabilities.
This surplus suggests that Yamaha has a conservative balance sheet, and could probably eliminate its debt without much difficulty. Succinctly put, Yamaha boasts net cash, so it's fair to say it does not have a heavy debt load!
See our latest analysis for Yamaha
The good news is that Yamaha has increased its EBIT by 8.4% over twelve months, which should ease any concerns about debt repayment. When analysing debt levels, the balance sheet is the obvious place to start. But it is future earnings, more than anything, that will determine Yamaha's ability to maintain a healthy balance sheet going forward. So if you want to see what the professionals think, you might find this free report on analyst profit forecasts to be interesting.
Finally, a business needs free cash flow to pay off debt; accounting profits just don't cut it. While Yamaha has net cash on its balance sheet, it's still worth taking a look at its ability to convert earnings before interest and tax (EBIT) to free cash flow, to help us understand how quickly it is building (or eroding) that cash balance. In the last three years, Yamaha created free cash flow amounting to 15% of its EBIT, an uninspiring performance. That limp level of cash conversion undermines its ability to manage and pay down debt.
Summing Up
While we empathize with investors who find debt concerning, you should keep in mind that Yamaha has net cash of JP¥99.5b, as well as more liquid assets than liabilities. And it also grew its EBIT by 8.4% over the last year. So we don't have any problem with Yamaha's use of debt. When analysing debt levels, the balance sheet is the obvious place to start. However, not all investment risk resides within the balance sheet - far from it. For example - Yamaha has 3 warning signs we think you should be aware of.
Of course, if you're the type of investor who prefers buying stocks without the burden of debt, then don't hesitate to discover our exclusive list of net cash growth stocks, today.
New: Manage All Your Stock Portfolios in One Place
We've created the ultimate portfolio companion for stock investors, and it's free.
• Connect an unlimited number of Portfolios and see your total in one currency
• Be alerted to new Warning Signs or Risks via email or mobile
• Track the Fair Value of your stocks
Have feedback on this article? Concerned about the content? Get in touch with us directly. Alternatively, email editorial-team (at) simplywallst.com.
This article by Simply Wall St is general in nature. We provide commentary based on historical data and analyst forecasts only using an unbiased methodology and our articles are not intended to be financial advice. It does not constitute a recommendation to buy or sell any stock, and does not take account of your objectives, or your financial situation. We aim to bring you long-term focused analysis driven by fundamental data. Note that our analysis may not factor in the latest price-sensitive company announcements or qualitative material. Simply Wall St has no position in any stocks mentioned.
About TSE:7951
Yamaha
Engages in the musical instruments, audio equipment, and other businesses in Japan and internationally.
Flawless balance sheet average dividend payer.
Similar Companies
Market Insights

Advertisement
Community Narratives
Kodiak AI - a potential 100 bagger opportunity?
Fair Value US$14.00|44.7% undervalued
DA
Community Contributor
A Fair Price for a Great Business Facing Real Threats
Fair Value US$383.06|13.0% undervalued
IM
Community Contributor
AXON And Shopify Integration Will Unlock Global Mobile Advertising
Fair Value US$646.30|7.3% undervalued
AN
Based on Analyst Price Targets