
Advertisement
- Japan
- /
- Consumer Durables
- /
- TSE:7837
Optimistic Investors Push R. C. Core Co., Ltd. (TSE:7837) Shares Up 26% But Growth Is Lacking
R. C. Core Co., Ltd. (TSE:7837) shares have continued their recent momentum with a 26% gain in the last month alone. While recent buyers may be laughing, long-term holders might not be as pleased since the recent gain only brings the stock back to where it started a year ago.
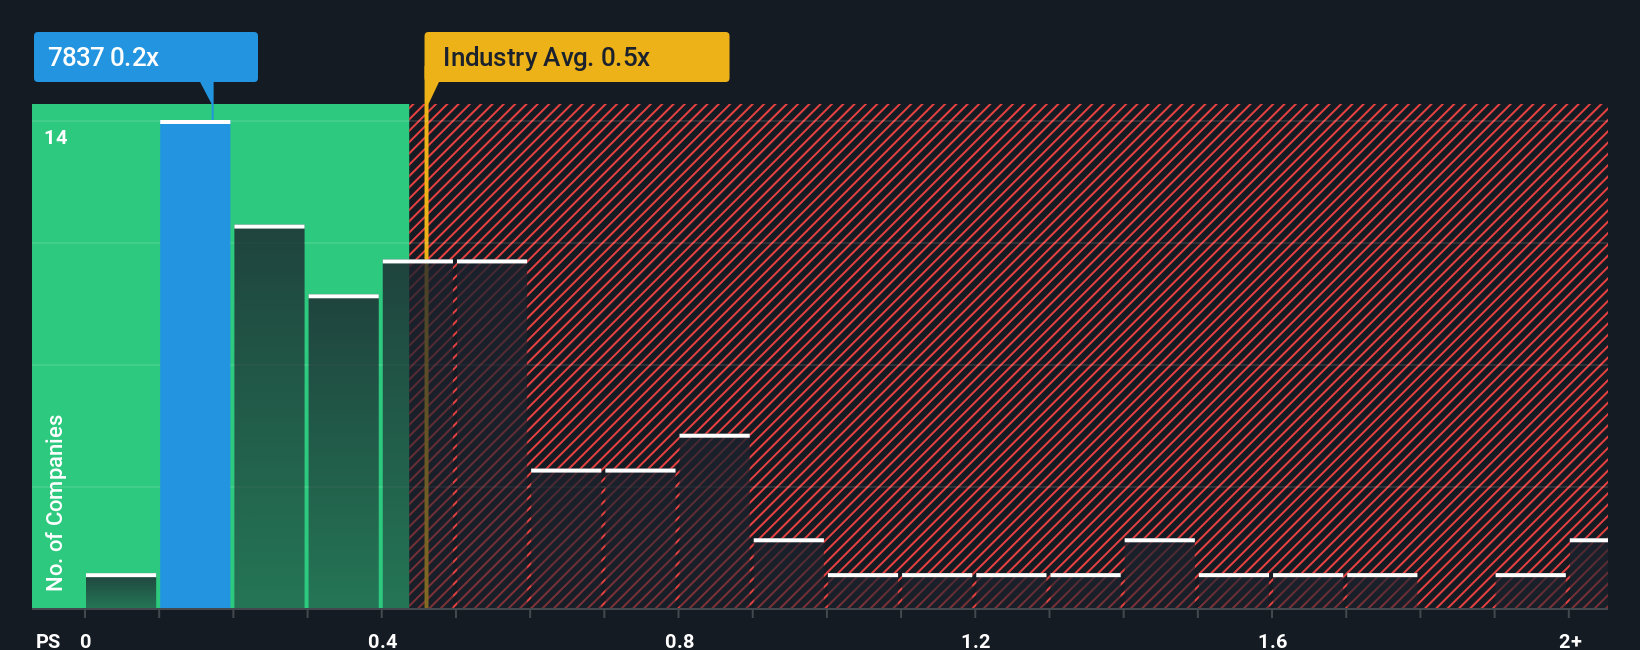
Even after such a large jump in price, it's still not a stretch to say that R. C. Core's price-to-sales (or "P/S") ratio of 0.2x right now seems quite "middle-of-the-road" compared to the Consumer Durables industry in Japan, where the median P/S ratio is around 0.5x. However, investors might be overlooking a clear opportunity or potential setback if there is no rational basis for the P/S.
View our latest analysis for R. C. Core
How Has R. C. Core Performed Recently?
For instance, R. C. Core's receding revenue in recent times would have to be some food for thought. Perhaps investors believe the recent revenue performance is enough to keep in line with the industry, which is keeping the P/S from dropping off. If you like the company, you'd at least be hoping this is the case so that you could potentially pick up some stock while it's not quite in favour.
Although there are no analyst estimates available for R. C. Core, take a look at this free data-rich visualisation to see how the company stacks up on earnings, revenue and cash flow.What Are Revenue Growth Metrics Telling Us About The P/S?
There's an inherent assumption that a company should be matching the industry for P/S ratios like R. C. Core's to be considered reasonable.
In reviewing the last year of financials, we were disheartened to see the company's revenues fell to the tune of 9.5%. This means it has also seen a slide in revenue over the longer-term as revenue is down 33% in total over the last three years. Therefore, it's fair to say the revenue growth recently has been undesirable for the company.
Weighing that medium-term revenue trajectory against the broader industry's one-year forecast for a contraction of 2.4% shows the industry is more attractive on an annualised basis regardless.
With this information, it's perhaps strange that R. C. Core is trading at a fairly similar P/S in comparison. With revenue going quickly in reverse, it's not guaranteed that the P/S has found a floor yet. There's potential for the P/S to fall to lower levels if the company doesn't improve its top-line growth, which would be difficult to do with the current industry outlook.
The Final Word
R. C. Core appears to be back in favour with a solid price jump bringing its P/S back in line with other companies in the industry While the price-to-sales ratio shouldn't be the defining factor in whether you buy a stock or not, it's quite a capable barometer of revenue expectations.
Our examination of R. C. Core revealed its sharp three-year contraction in revenue isn't impacting its P/S as much as we would have predicted, given the industry is set to shrink less severely. Right now we are uncomfortable with the P/S as this revenue performance isn't likely to support a more positive sentiment for long. In addition, we would be concerned whether the company can even maintain its medium-term level of performance under these tough industry conditions. Unless the company's relative performance improves, it's challenging to accept these prices as being reasonable.
Before you settle on your opinion, we've discovered 2 warning signs for R. C. Core that you should be aware of.
If you're unsure about the strength of R. C. Core's business, why not explore our interactive list of stocks with solid business fundamentals for some other companies you may have missed.
New: AI Stock Screener & Alerts
Our new AI Stock Screener scans the market every day to uncover opportunities.
• Dividend Powerhouses (3%+ Yield)
• Undervalued Small Caps with Insider Buying
• High growth Tech and AI Companies
Or build your own from over 50 metrics.
Have feedback on this article? Concerned about the content? Get in touch with us directly. Alternatively, email editorial-team (at) simplywallst.com.
This article by Simply Wall St is general in nature. We provide commentary based on historical data and analyst forecasts only using an unbiased methodology and our articles are not intended to be financial advice. It does not constitute a recommendation to buy or sell any stock, and does not take account of your objectives, or your financial situation. We aim to bring you long-term focused analysis driven by fundamental data. Note that our analysis may not factor in the latest price-sensitive company announcements or qualitative material. Simply Wall St has no position in any stocks mentioned.
About TSE:7837
R. C. Core
Plans, manufactures, and sells log and natural individualized housing in Japan.
Adequate balance sheet and slightly overvalued.
Market Insights

Advertisement
Community Narratives
MicroVision will explode future revenue by 380.37% with a vision towards success
Fair Value US$60.00|98.4% undervalued
TH
Community Contributor
The Indispensable Artery for a New North American Economy
Fair Value CA$132.87|1.3% undervalued
TI
Community Contributor