
Advertisement
- Japan
- /
- Consumer Durables
- /
- TSE:3246
KOSE R.E.Ltd's (TSE:3246) Sluggish Earnings Might Be Just The Beginning Of Its Problems
KOSE R.E. Co.,Ltd.'s (TSE:3246) recent weak earnings report didn't cause a big stock movement. However, we believe that investors should be aware of some underlying factors which may be of concern.
A Closer Look At KOSE R.E.Ltd's Earnings
One key financial ratio used to measure how well a company converts its profit to free cash flow (FCF) is the accrual ratio. To get the accrual ratio we first subtract FCF from profit for a period, and then divide that number by the average operating assets for the period. This ratio tells us how much of a company's profit is not backed by free cashflow.
As a result, a negative accrual ratio is a positive for the company, and a positive accrual ratio is a negative. While having an accrual ratio above zero is of little concern, we do think it's worth noting when a company has a relatively high accrual ratio. That's because some academic studies have suggested that high accruals ratios tend to lead to lower profit or less profit growth.
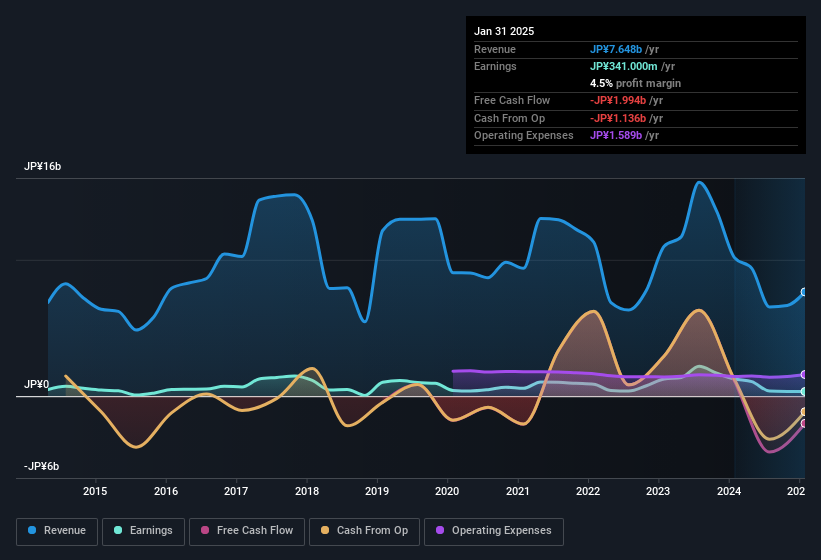
Over the twelve months to January 2025, KOSE R.E.Ltd recorded an accrual ratio of 0.26. Unfortunately, that means its free cash flow fell significantly short of its reported profits. In the last twelve months it actually had negative free cash flow, with an outflow of JP¥2.0b despite its profit of JP¥341.0m, mentioned above. We saw that FCF was JP¥1.1b a year ago though, so KOSE R.E.Ltd has at least been able to generate positive FCF in the past.
Note: we always recommend investors check balance sheet strength. Click here to be taken to our balance sheet analysis of KOSE R.E.Ltd.
Our Take On KOSE R.E.Ltd's Profit Performance
KOSE R.E.Ltd's accrual ratio for the last twelve months signifies cash conversion is less than ideal, which is a negative when it comes to our view of its earnings. Because of this, we think that it may be that KOSE R.E.Ltd's statutory profits are better than its underlying earnings power. Sadly, its EPS was down over the last twelve months. The goal of this article has been to assess how well we can rely on the statutory earnings to reflect the company's potential, but there is plenty more to consider. In light of this, if you'd like to do more analysis on the company, it's vital to be informed of the risks involved. When we did our research, we found 4 warning signs for KOSE R.E.Ltd (1 shouldn't be ignored!) that we believe deserve your full attention.
Today we've zoomed in on a single data point to better understand the nature of KOSE R.E.Ltd's profit. But there is always more to discover if you are capable of focussing your mind on minutiae. For example, many people consider a high return on equity as an indication of favorable business economics, while others like to 'follow the money' and search out stocks that insiders are buying. So you may wish to see this free collection of companies boasting high return on equity, or this list of stocks with high insider ownership.
Valuation is complex, but we're here to simplify it.
Discover if KOSE R.E.Ltd might be undervalued or overvalued with our detailed analysis, featuring fair value estimates, potential risks, dividends, insider trades, and its financial condition.
Access Free AnalysisHave feedback on this article? Concerned about the content? Get in touch with us directly. Alternatively, email editorial-team (at) simplywallst.com.
This article by Simply Wall St is general in nature. We provide commentary based on historical data and analyst forecasts only using an unbiased methodology and our articles are not intended to be financial advice. It does not constitute a recommendation to buy or sell any stock, and does not take account of your objectives, or your financial situation. We aim to bring you long-term focused analysis driven by fundamental data. Note that our analysis may not factor in the latest price-sensitive company announcements or qualitative material. Simply Wall St has no position in any stocks mentioned.
About TSE:3246
Moderate risk with adequate balance sheet.
Market Insights

Advertisement
Weekly Picks
RO


RockeTeller on Santacruz Silver Mining ·
Crazy Undervalued 42 Baggers Silver Play (Active & Running Mine)
Fair Value:CA$8696.7% undervalued
32 followersusers have followed this narrative
6 commentsusers have commented on this narrative
9 likesusers have liked this narrative
RO


Robbo on Fiducian Group ·
Fiducian: Compliance Clouds or Value Opportunity?
Fair Value:AU$126.1% undervalued
4 followersusers have followed this narrative
0 commentsusers have commented on this narrative
0 likesusers have liked this narrative
WO

woodworthfund on Willamette Valley Vineyards ·
Willamette Valley Vineyards (WVVI): Not-So-Great Value
Fair Value:US$242.5% overvalued
6 followersusers have followed this narrative
0 commentsusers have commented on this narrative
1 likeusers have liked this narrative
Recently Updated Narratives
MA


MarkoVT on Alphabet ·
Positioned globally, partnered locally
Fair Value:US$390.1919.1% undervalued
1 followerusers have followed this narrative
0 commentsusers have commented on this narrative
0 likesusers have liked this narrative
JO


JohnJ on Worldline ·
When will fraudsters be investigated in depth. Fraud was ongoing in France too.
Fair Value:€0.5190.0% overvalued
1 followerusers have followed this narrative
0 commentsusers have commented on this narrative
0 likesusers have liked this narrative
MA

MarkoVT on Applied Digital ·
Staggered by dilution; positions for growth
Fair Value:US$35.4520.9% undervalued
5 followersusers have followed this narrative
0 commentsusers have commented on this narrative
0 likesusers have liked this narrative
Popular Narratives
TH


TheWallstreetKing on MicroVision ·
MicroVision will explode future revenue by 380.37% with a vision towards success
Fair Value:US$6098.6% undervalued
112 followersusers have followed this narrative
11 commentsusers have commented on this narrative
22 likesusers have liked this narrative
AN


AnalystConsensusTarget on NVIDIA ·
NVDA: Expanding AI Demand Will Drive Major Data Center Investments Through 2026
Fair Value:US$250.3927.5% undervalued
950 followersusers have followed this narrative
6 commentsusers have commented on this narrative
25 likesusers have liked this narrative
OS

oscargarcia on Alphabet ·
The company that turned a verb into a global necessity and basically runs the modern internet, digital ads, smartphones, maps, and AI.
Fair Value:US$3407.1% undervalued
148 followersusers have followed this narrative
6 commentsusers have commented on this narrative
18 likesusers have liked this narrative

