
Advertisement
- Japan
- /
- Consumer Durables
- /
- TSE:1873
Nihon House Holdings (TSE:1873) Is Finding It Tricky To Allocate Its Capital
What financial metrics can indicate to us that a company is maturing or even in decline? Typically, we'll see the trend of both return on capital employed (ROCE) declining and this usually coincides with a decreasing amount of capital employed. Trends like this ultimately mean the business is reducing its investments and also earning less on what it has invested. So after we looked into Nihon House Holdings (TSE:1873), the trends above didn't look too great.
Understanding Return On Capital Employed (ROCE)
For those that aren't sure what ROCE is, it measures the amount of pre-tax profits a company can generate from the capital employed in its business. The formula for this calculation on Nihon House Holdings is:
Return on Capital Employed = Earnings Before Interest and Tax (EBIT) ÷ (Total Assets - Current Liabilities)
0.052 = JP¥1.6b ÷ (JP¥43b - JP¥13b) (Based on the trailing twelve months to April 2024).
Therefore, Nihon House Holdings has an ROCE of 5.2%. Ultimately, that's a low return and it under-performs the Consumer Durables industry average of 6.9%.
See our latest analysis for Nihon House Holdings
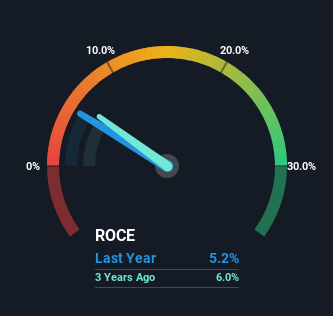
Historical performance is a great place to start when researching a stock so above you can see the gauge for Nihon House Holdings' ROCE against it's prior returns. If you want to delve into the historical earnings , check out these free graphs detailing revenue and cash flow performance of Nihon House Holdings .
What Does the ROCE Trend For Nihon House Holdings Tell Us?
We are a bit worried about the trend of returns on capital at Nihon House Holdings. About five years ago, returns on capital were 7.8%, however they're now substantially lower than that as we saw above. Meanwhile, capital employed in the business has stayed roughly the flat over the period. Since returns are falling and the business has the same amount of assets employed, this can suggest it's a mature business that hasn't had much growth in the last five years. So because these trends aren't typically conducive to creating a multi-bagger, we wouldn't hold our breath on Nihon House Holdings becoming one if things continue as they have.
On a side note, Nihon House Holdings has done well to pay down its current liabilities to 31% of total assets. That could partly explain why the ROCE has dropped. What's more, this can reduce some aspects of risk to the business because now the company's suppliers or short-term creditors are funding less of its operations. Since the business is basically funding more of its operations with it's own money, you could argue this has made the business less efficient at generating ROCE.
In Conclusion...
In the end, the trend of lower returns on the same amount of capital isn't typically an indication that we're looking at a growth stock. Despite the concerning underlying trends, the stock has actually gained 23% over the last five years, so it might be that the investors are expecting the trends to reverse. Regardless, we don't like the trends as they are and if they persist, we think you might find better investments elsewhere.
Since virtually every company faces some risks, it's worth knowing what they are, and we've spotted 4 warning signs for Nihon House Holdings (of which 1 is significant!) that you should know about.
While Nihon House Holdings may not currently earn the highest returns, we've compiled a list of companies that currently earn more than 25% return on equity. Check out this free list here.
Valuation is complex, but we're here to simplify it.
Discover if Nihon House Holdings might be undervalued or overvalued with our detailed analysis, featuring fair value estimates, potential risks, dividends, insider trades, and its financial condition.
Access Free AnalysisHave feedback on this article? Concerned about the content? Get in touch with us directly. Alternatively, email editorial-team (at) simplywallst.com.
This article by Simply Wall St is general in nature. We provide commentary based on historical data and analyst forecasts only using an unbiased methodology and our articles are not intended to be financial advice. It does not constitute a recommendation to buy or sell any stock, and does not take account of your objectives, or your financial situation. We aim to bring you long-term focused analysis driven by fundamental data. Note that our analysis may not factor in the latest price-sensitive company announcements or qualitative material. Simply Wall St has no position in any stocks mentioned.
About TSE:1873
Nihon House Holdings
Primarily engages in the design, construction, supervision, and sales of conventional wooden houses in Japan.
Excellent balance sheet with proven track record.
Market Insights


Advertisement
Community Narratives
Pole position to benefit from GENIUS Act
Fair Value US$233.04|58.8% undervalued
CH
Community Contributor
IREN will transform from bitcoin miner to leader in AI infrastructure
Fair Value US$21.48|17.5% undervalued
KA
Community Contributor
Behind the Assay: XRF Scientific’s Role in Modern Mining Economics
Fair Value AU$2.10|2.4% undervalued
RO
Community Contributor