
Advertisement
- Japan
- /
- Professional Services
- /
- TSE:9743
Does Tanseisha Co., Ltd.'s (TSE:9743) Weak Fundamentals Mean That The Market Could Correct Its Share Price?
Tanseisha's (TSE:9743) stock is up by a considerable 14% over the past week. However, we decided to pay close attention to its weak financials as we are doubtful that the current momentum will keep up, given the scenario. Specifically, we decided to study Tanseisha's ROE in this article.
Return on Equity or ROE is a test of how effectively a company is growing its value and managing investors’ money. Simply put, it is used to assess the profitability of a company in relation to its equity capital.
View our latest analysis for Tanseisha
How Is ROE Calculated?
The formula for ROE is:
Return on Equity = Net Profit (from continuing operations) ÷ Shareholders' Equity
So, based on the above formula, the ROE for Tanseisha is:
8.8% = JP¥2.8b ÷ JP¥32b (Based on the trailing twelve months to January 2024).
The 'return' is the profit over the last twelve months. That means that for every ¥1 worth of shareholders' equity, the company generated ¥0.09 in profit.
Why Is ROE Important For Earnings Growth?
Thus far, we have learned that ROE measures how efficiently a company is generating its profits. Based on how much of its profits the company chooses to reinvest or "retain", we are then able to evaluate a company's future ability to generate profits. Assuming everything else remains unchanged, the higher the ROE and profit retention, the higher the growth rate of a company compared to companies that don't necessarily bear these characteristics.
A Side By Side comparison of Tanseisha's Earnings Growth And 8.8% ROE
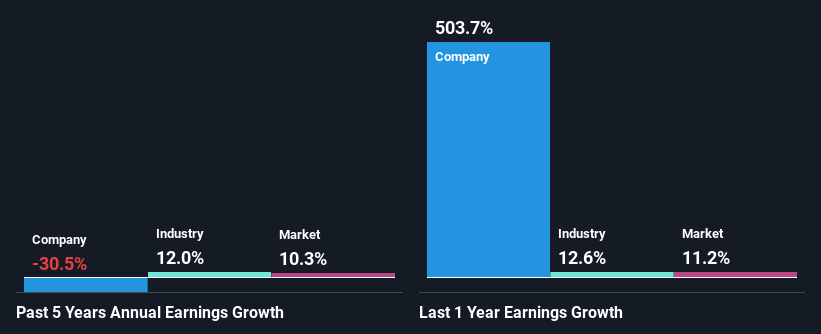
At first glance, Tanseisha seems to have a decent ROE. Be that as it may, the company's ROE is still quite lower than the industry average of 13%. Moreover, Tanseisha's net income shrunk at a rate of 30%over the past five years. Not to forget, the company does have a high ROE to begin with, just that it is lower than the industry average. So there might be other reasons for the earnings to shrink. For example, it could be that the company has a high payout ratio or the business has allocated capital poorly, for instance.
So, as a next step, we compared Tanseisha's performance against the industry and were disappointed to discover that while the company has been shrinking its earnings, the industry has been growing its earnings at a rate of 12% over the last few years.
Earnings growth is a huge factor in stock valuation. The investor should try to establish if the expected growth or decline in earnings, whichever the case may be, is priced in. This then helps them determine if the stock is placed for a bright or bleak future. One good indicator of expected earnings growth is the P/E ratio which determines the price the market is willing to pay for a stock based on its earnings prospects. So, you may want to check if Tanseisha is trading on a high P/E or a low P/E, relative to its industry.
Is Tanseisha Efficiently Re-investing Its Profits?
With a high three-year median payout ratio of 92% (implying that 8.0% of the profits are retained), most of Tanseisha's profits are being paid to shareholders, which explains the company's shrinking earnings. The business is only left with a small pool of capital to reinvest - A vicious cycle that doesn't benefit the company in the long-run. To know the 2 risks we have identified for Tanseisha visit our risks dashboard for free.
Additionally, Tanseisha has paid dividends over a period of at least ten years, which means that the company's management is determined to pay dividends even if it means little to no earnings growth.
Summary
Overall, we would be extremely cautious before making any decision on Tanseisha. Its earnings growth particularly is not much to talk about even though it does have a pretty respectable ROE. The lack of growth can be blamed on its poor earnings retention. As discussed earlier, the company is retaining hardly any of its profits. Until now, we have only just grazed the surface of the company's past performance by looking at the company's fundamentals. So it may be worth checking this free detailed graph of Tanseisha's past earnings, as well as revenue and cash flows to get a deeper insight into the company's performance.
Valuation is complex, but we're here to simplify it.
Discover if Tanseisha might be undervalued or overvalued with our detailed analysis, featuring fair value estimates, potential risks, dividends, insider trades, and its financial condition.
Access Free AnalysisHave feedback on this article? Concerned about the content? Get in touch with us directly. Alternatively, email editorial-team (at) simplywallst.com.
This article by Simply Wall St is general in nature. We provide commentary based on historical data and analyst forecasts only using an unbiased methodology and our articles are not intended to be financial advice. It does not constitute a recommendation to buy or sell any stock, and does not take account of your objectives, or your financial situation. We aim to bring you long-term focused analysis driven by fundamental data. Note that our analysis may not factor in the latest price-sensitive company announcements or qualitative material. Simply Wall St has no position in any stocks mentioned.
Have feedback on this article? Concerned about the content? Get in touch with us directly. Alternatively, email editorial-team@simplywallst.com
About TSE:9743
Tanseisha
Engages in the research, planning, design, layout, production, construction, and operation of commercial, public, hospitality, event, and business and cultural spaces in Japan and internationally.
Solid track record with excellent balance sheet and pays a dividend.
Market Insights

Advertisement
Community Narratives
Quality at a Premium. A time to watch, not to buy?
Fair Value US$154.56|29.3% undervalued
DA
Community Contributor
GRAB: The Super-App at the Heart of Southeast Asia’s Digital Boom
Fair Value US$6.60|7.0% undervalued
BL
Community Contributor
Verve Group to Surge with 51.61% Revenue Growth
Fair Value €6.00|65.0% undervalued
ME
Community Contributor