
Advertisement
- Japan
- /
- Commercial Services
- /
- TSE:9735
Institutional investors may overlook SECOM CO., LTD.'s (TSE:9735) recent JP¥66b market cap drop as long-term gains remain positive

Key Insights
- Given the large stake in the stock by institutions, SECOM's stock price might be vulnerable to their trading decisions
- The top 25 shareholders own 47% of the company
- Analyst forecasts along with ownership data serve to give a strong idea about prospects for a business
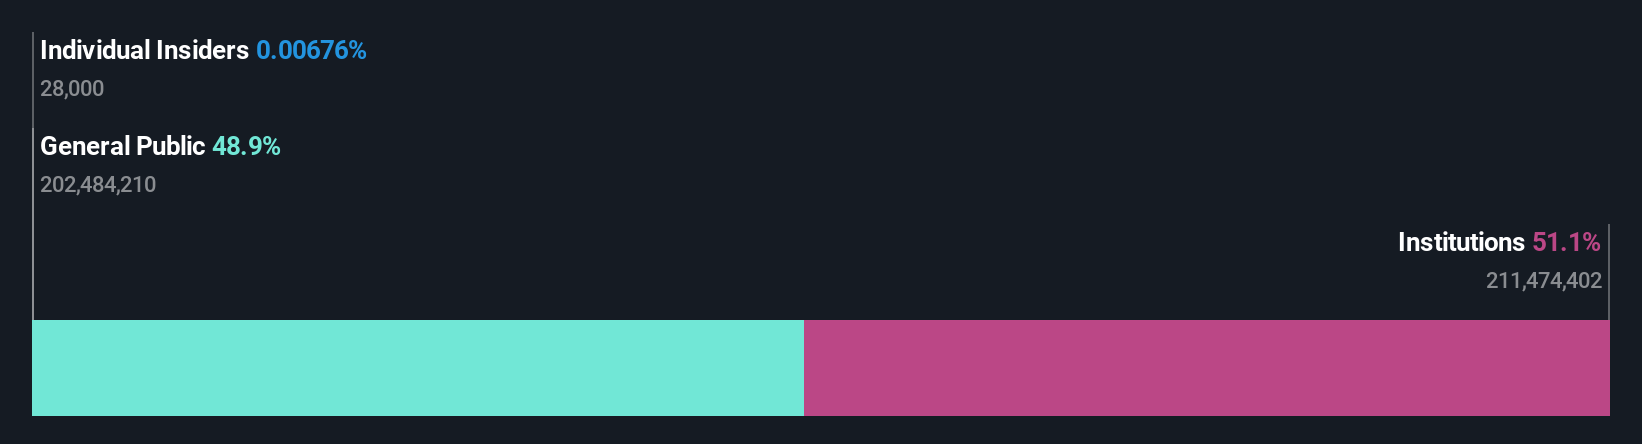
Every investor in SECOM CO., LTD. (TSE:9735) should be aware of the most powerful shareholder groups. The group holding the most number of shares in the company, around 51% to be precise, is institutions. In other words, the group stands to gain the most (or lose the most) from their investment into the company.
No shareholder likes losing money on their investments, especially institutional investors who saw their holdings drop 3.0% in value last week. However, the 11% one-year return to shareholders might have softened the blow. They should, however, be mindful of further losses in the future.
Let's delve deeper into each type of owner of SECOM, beginning with the chart below.
See our latest analysis for SECOM
What Does The Institutional Ownership Tell Us About SECOM?
Institutional investors commonly compare their own returns to the returns of a commonly followed index. So they generally do consider buying larger companies that are included in the relevant benchmark index.
We can see that SECOM does have institutional investors; and they hold a good portion of the company's stock. This can indicate that the company has a certain degree of credibility in the investment community. However, it is best to be wary of relying on the supposed validation that comes with institutional investors. They too, get it wrong sometimes. If multiple institutions change their view on a stock at the same time, you could see the share price drop fast. It's therefore worth looking at SECOM's earnings history below. Of course, the future is what really matters.
Institutional investors own over 50% of the company, so together than can probably strongly influence board decisions. We note that hedge funds don't have a meaningful investment in SECOM. Looking at our data, we can see that the largest shareholder is BlackRock, Inc. with 9.5% of shares outstanding. For context, the second largest shareholder holds about 7.8% of the shares outstanding, followed by an ownership of 5.0% by the third-largest shareholder.
A deeper look at our ownership data shows that the top 25 shareholders collectively hold less than half of the register, suggesting a large group of small holders where no single shareholder has a majority.
Researching institutional ownership is a good way to gauge and filter a stock's expected performance. The same can be achieved by studying analyst sentiments. There are plenty of analysts covering the stock, so it might be worth seeing what they are forecasting, too.
Insider Ownership Of SECOM
While the precise definition of an insider can be subjective, almost everyone considers board members to be insiders. Management ultimately answers to the board. However, it is not uncommon for managers to be executive board members, especially if they are a founder or the CEO.
Most consider insider ownership a positive because it can indicate the board is well aligned with other shareholders. However, on some occasions too much power is concentrated within this group.
Our most recent data indicates that insiders own less than 1% of SECOM CO., LTD.. As it is a large company, we'd only expect insiders to own a small percentage of it. But it's worth noting that they own JP¥144m worth of shares. In this sort of situation, it can be more interesting to see if those insiders have been buying or selling.
General Public Ownership
The general public, who are usually individual investors, hold a 49% stake in SECOM. While this size of ownership may not be enough to sway a policy decision in their favour, they can still make a collective impact on company policies.
Next Steps:
I find it very interesting to look at who exactly owns a company. But to truly gain insight, we need to consider other information, too.
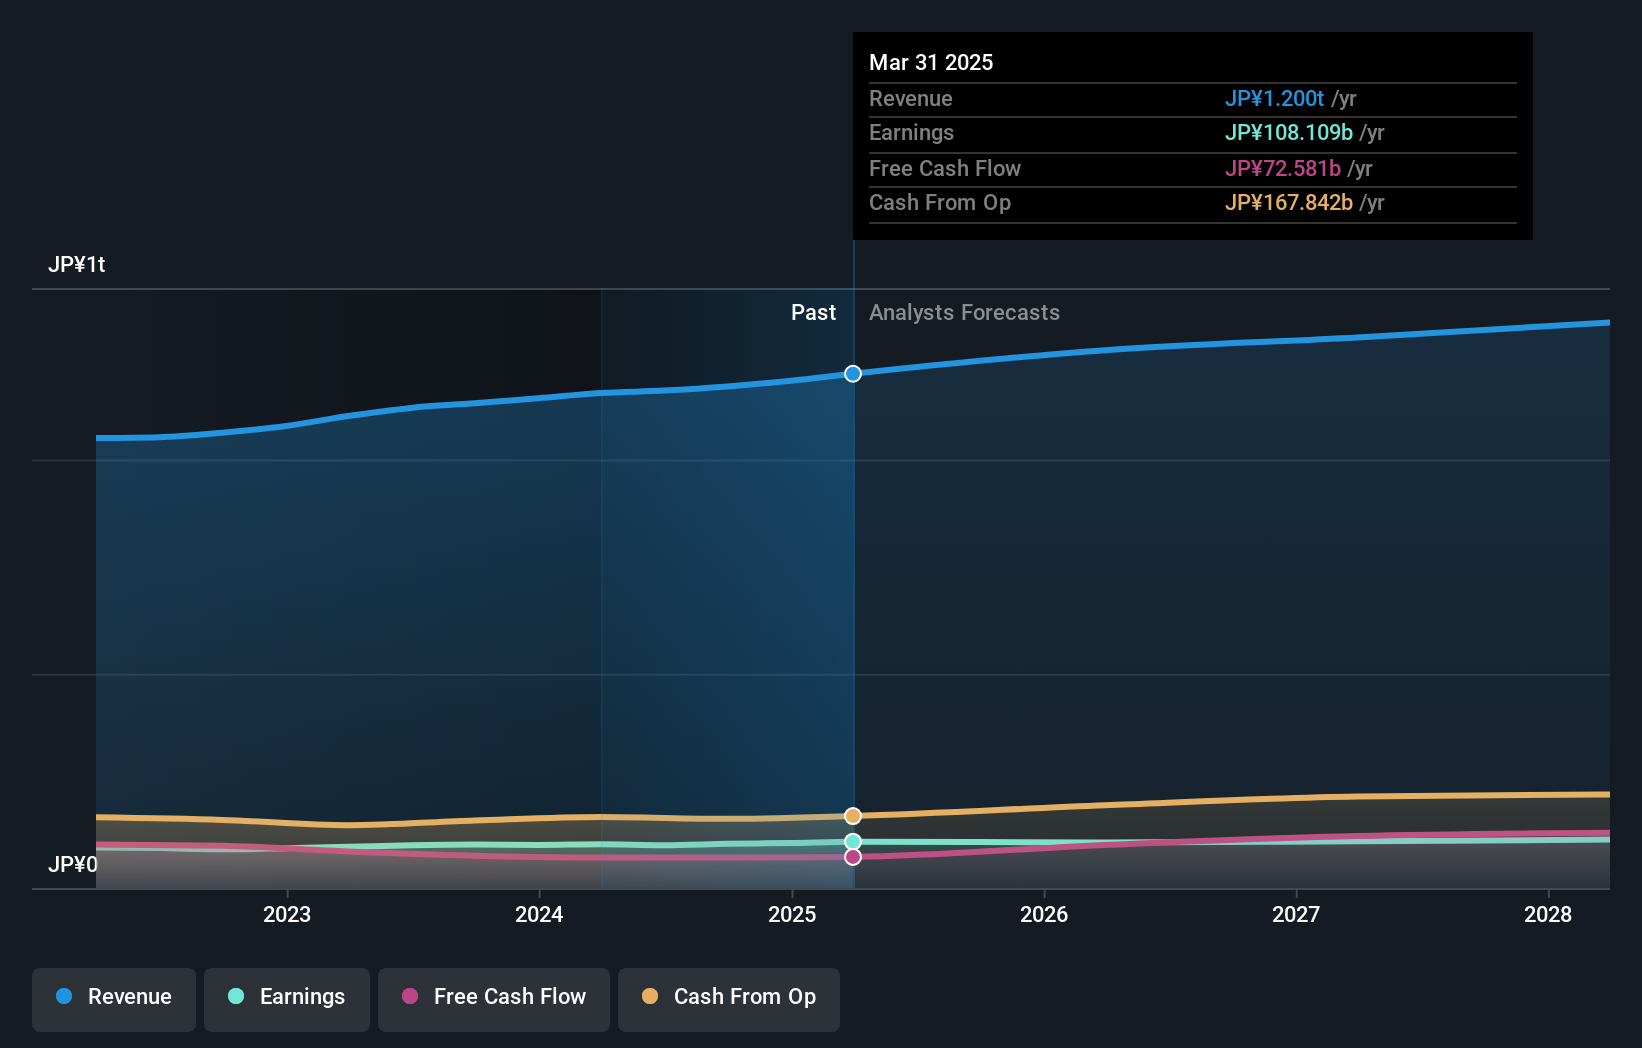
I always like to check for a history of revenue growth. You can too, by accessing this free chart of historic revenue and earnings in this detailed graph.
If you are like me, you may want to think about whether this company will grow or shrink. Luckily, you can check this free report showing analyst forecasts for its future.
NB: Figures in this article are calculated using data from the last twelve months, which refer to the 12-month period ending on the last date of the month the financial statement is dated. This may not be consistent with full year annual report figures.
New: Manage All Your Stock Portfolios in One Place
We've created the ultimate portfolio companion for stock investors, and it's free.
• Connect an unlimited number of Portfolios and see your total in one currency
• Be alerted to new Warning Signs or Risks via email or mobile
• Track the Fair Value of your stocks
Have feedback on this article? Concerned about the content? Get in touch with us directly. Alternatively, email editorial-team (at) simplywallst.com.
This article by Simply Wall St is general in nature. We provide commentary based on historical data and analyst forecasts only using an unbiased methodology and our articles are not intended to be financial advice. It does not constitute a recommendation to buy or sell any stock, and does not take account of your objectives, or your financial situation. We aim to bring you long-term focused analysis driven by fundamental data. Note that our analysis may not factor in the latest price-sensitive company announcements or qualitative material. Simply Wall St has no position in any stocks mentioned.
About TSE:9735
Flawless balance sheet established dividend payer.
Similar Companies
Market Insights


Advertisement
Community Narratives
Suncorp’s Next Chapter: Insurance-Only and Ready to Grow
Fair Value AU$22.83|5.7% undervalued
RO
Community Contributor
Thyssenkrupp Nucera Will Achieve Double-Digit Profits by 2030 Boosted by Hydrogen Growth
Fair Value €14.40|31.6% undervalued
CH
Community Contributor
Tesla’s Nvidia Moment – The AI & Robotics Inflection Point
Fair Value US$384.84|18.0% undervalued
BL
Community Contributor