
Key Insights
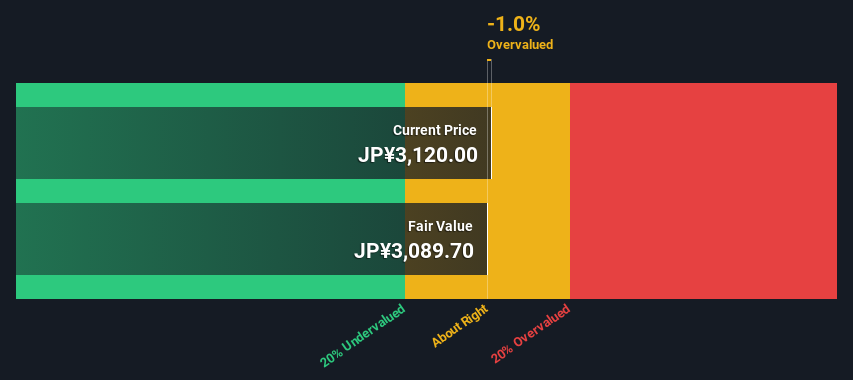
- Daiei Kankyo's estimated fair value is JP¥3,090 based on 2 Stage Free Cash Flow to Equity
- Current share price of JP¥3,120 suggests Daiei Kankyo is potentially trading close to its fair value
- Our fair value estimate is 4.4% lower than Daiei Kankyo's analyst price target of JP¥3,233
Today we will run through one way of estimating the intrinsic value of Daiei Kankyo Co., Ltd. (TSE:9336) by estimating the company's future cash flows and discounting them to their present value. We will use the Discounted Cash Flow (DCF) model on this occasion. Models like these may appear beyond the comprehension of a lay person, but they're fairly easy to follow.
Companies can be valued in a lot of ways, so we would point out that a DCF is not perfect for every situation. For those who are keen learners of equity analysis, the Simply Wall St analysis model here may be something of interest to you.
View our latest analysis for Daiei Kankyo
What's The Estimated Valuation?
We are going to use a two-stage DCF model, which, as the name states, takes into account two stages of growth. The first stage is generally a higher growth period which levels off heading towards the terminal value, captured in the second 'steady growth' period. In the first stage we need to estimate the cash flows to the business over the next ten years. Where possible we use analyst estimates, but when these aren't available we extrapolate the previous free cash flow (FCF) from the last estimate or reported value. We assume companies with shrinking free cash flow will slow their rate of shrinkage, and that companies with growing free cash flow will see their growth rate slow, over this period. We do this to reflect that growth tends to slow more in the early years than it does in later years.
Generally we assume that a dollar today is more valuable than a dollar in the future, and so the sum of these future cash flows is then discounted to today's value:
10-year free cash flow (FCF) forecast
| 2025 | 2026 | 2027 | 2028 | 2029 | 2030 | 2031 | 2032 | 2033 | 2034 | |
| Levered FCF (¥, Millions) | JP¥8.07b | JP¥7.06b | JP¥8.41b | JP¥10.2b | JP¥12.4b | JP¥13.9b | JP¥15.1b | JP¥16.0b | JP¥16.7b | JP¥17.3b |
| Growth Rate Estimate Source | Analyst x2 | Analyst x3 | Analyst x1 | Analyst x1 | Analyst x1 | Est @ 12.26% | Est @ 8.66% | Est @ 6.14% | Est @ 4.38% | Est @ 3.14% |
| Present Value (¥, Millions) Discounted @ 5.2% | JP¥7.7k | JP¥6.4k | JP¥7.2k | JP¥8.4k | JP¥9.6k | JP¥10.3k | JP¥10.6k | JP¥10.7k | JP¥10.6k | JP¥10.4k |
("Est" = FCF growth rate estimated by Simply Wall St)
Present Value of 10-year Cash Flow (PVCF) = JP¥92b
After calculating the present value of future cash flows in the initial 10-year period, we need to calculate the Terminal Value, which accounts for all future cash flows beyond the first stage. The Gordon Growth formula is used to calculate Terminal Value at a future annual growth rate equal to the 5-year average of the 10-year government bond yield of 0.3%. We discount the terminal cash flows to today's value at a cost of equity of 5.2%.
Terminal Value (TV)= FCF2034 × (1 + g) ÷ (r – g) = JP¥17b× (1 + 0.3%) ÷ (5.2%– 0.3%) = JP¥352b
Present Value of Terminal Value (PVTV)= TV / (1 + r)10= JP¥352b÷ ( 1 + 5.2%)10= JP¥212b
The total value is the sum of cash flows for the next ten years plus the discounted terminal value, which results in the Total Equity Value, which in this case is JP¥304b. In the final step we divide the equity value by the number of shares outstanding. Compared to the current share price of JP¥3.1k, the company appears around fair value at the time of writing. Valuations are imprecise instruments though, rather like a telescope - move a few degrees and end up in a different galaxy. Do keep this in mind.
The Assumptions
Now the most important inputs to a discounted cash flow are the discount rate, and of course, the actual cash flows. Part of investing is coming up with your own evaluation of a company's future performance, so try the calculation yourself and check your own assumptions. The DCF also does not consider the possible cyclicality of an industry, or a company's future capital requirements, so it does not give a full picture of a company's potential performance. Given that we are looking at Daiei Kankyo as potential shareholders, the cost of equity is used as the discount rate, rather than the cost of capital (or weighted average cost of capital, WACC) which accounts for debt. In this calculation we've used 5.2%, which is based on a levered beta of 0.988. Beta is a measure of a stock's volatility, compared to the market as a whole. We get our beta from the industry average beta of globally comparable companies, with an imposed limit between 0.8 and 2.0, which is a reasonable range for a stable business.
SWOT Analysis for Daiei Kankyo
- Earnings growth over the past year exceeded the industry.
- Debt is not viewed as a risk.
- Dividends are covered by earnings and cash flows.
- Dividend is low compared to the top 25% of dividend payers in the Commercial Services market.
- Expensive based on P/E ratio and estimated fair value.
- Annual revenue is forecast to grow faster than the Japanese market.
- Annual earnings are forecast to grow slower than the Japanese market.
Next Steps:
Valuation is only one side of the coin in terms of building your investment thesis, and it shouldn't be the only metric you look at when researching a company. DCF models are not the be-all and end-all of investment valuation. Rather it should be seen as a guide to "what assumptions need to be true for this stock to be under/overvalued?" If a company grows at a different rate, or if its cost of equity or risk free rate changes sharply, the output can look very different. For Daiei Kankyo, we've put together three important elements you should look at:
- Financial Health: Does 9336 have a healthy balance sheet? Take a look at our free balance sheet analysis with six simple checks on key factors like leverage and risk.
- Future Earnings: How does 9336's growth rate compare to its peers and the wider market? Dig deeper into the analyst consensus number for the upcoming years by interacting with our free analyst growth expectation chart.
- Other High Quality Alternatives: Do you like a good all-rounder? Explore our interactive list of high quality stocks to get an idea of what else is out there you may be missing!
PS. The Simply Wall St app conducts a discounted cash flow valuation for every stock on the TSE every day. If you want to find the calculation for other stocks just search here.
New: Manage All Your Stock Portfolios in One Place
We've created the ultimate portfolio companion for stock investors, and it's free.
• Connect an unlimited number of Portfolios and see your total in one currency
• Be alerted to new Warning Signs or Risks via email or mobile
• Track the Fair Value of your stocks
Have feedback on this article? Concerned about the content? Get in touch with us directly. Alternatively, email editorial-team (at) simplywallst.com.
This article by Simply Wall St is general in nature. We provide commentary based on historical data and analyst forecasts only using an unbiased methodology and our articles are not intended to be financial advice. It does not constitute a recommendation to buy or sell any stock, and does not take account of your objectives, or your financial situation. We aim to bring you long-term focused analysis driven by fundamental data. Note that our analysis may not factor in the latest price-sensitive company announcements or qualitative material. Simply Wall St has no position in any stocks mentioned.
About TSE:9336
Daiei Kankyo
Engages in waste-related and valuable resource recycling businesses in Japan.
Excellent balance sheet and fair value.
Market Insights

Community Narratives

