
Advertisement

David Iben put it well when he said, 'Volatility is not a risk we care about. What we care about is avoiding the permanent loss of capital.' So it seems the smart money knows that debt - which is usually involved in bankruptcies - is a very important factor, when you assess how risky a company is. As with many other companies Okamura Corporation (TSE:7994) makes use of debt. But the more important question is: how much risk is that debt creating?
Why Does Debt Bring Risk?
Debt and other liabilities become risky for a business when it cannot easily fulfill those obligations, either with free cash flow or by raising capital at an attractive price. If things get really bad, the lenders can take control of the business. However, a more frequent (but still costly) occurrence is where a company must issue shares at bargain-basement prices, permanently diluting shareholders, just to shore up its balance sheet. Of course, debt can be an important tool in businesses, particularly capital heavy businesses. When we think about a company's use of debt, we first look at cash and debt together.
Check out our latest analysis for Okamura
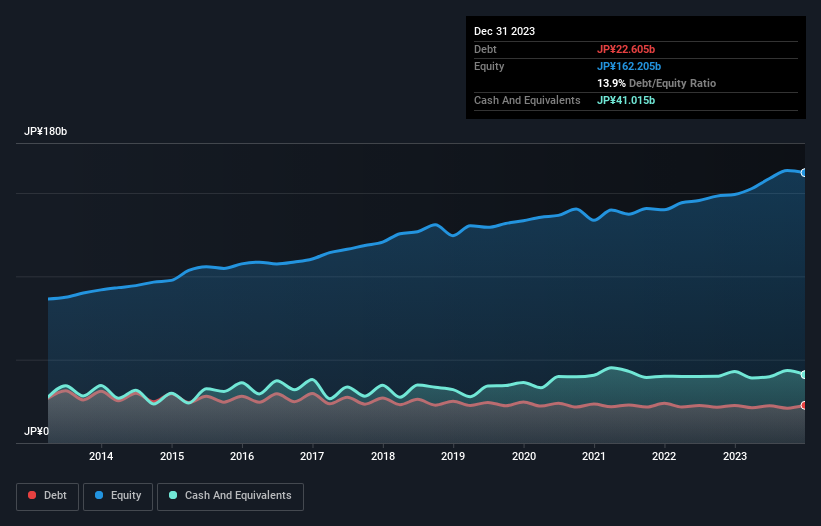
What Is Okamura's Net Debt?
As you can see below, Okamura had JP¥22.6b of debt, at December 2023, which is about the same as the year before. You can click the chart for greater detail. But on the other hand it also has JP¥41.0b in cash, leading to a JP¥18.4b net cash position.
A Look At Okamura's Liabilities
We can see from the most recent balance sheet that Okamura had liabilities of JP¥62.7b falling due within a year, and liabilities of JP¥32.2b due beyond that. On the other hand, it had cash of JP¥41.0b and JP¥61.4b worth of receivables due within a year. So it actually has JP¥7.61b more liquid assets than total liabilities.
This short term liquidity is a sign that Okamura could probably pay off its debt with ease, as its balance sheet is far from stretched. Simply put, the fact that Okamura has more cash than debt is arguably a good indication that it can manage its debt safely.
In addition to that, we're happy to report that Okamura has boosted its EBIT by 54%, thus reducing the spectre of future debt repayments. There's no doubt that we learn most about debt from the balance sheet. But it is future earnings, more than anything, that will determine Okamura's ability to maintain a healthy balance sheet going forward. So if you're focused on the future you can check out this free report showing analyst profit forecasts.
Finally, a company can only pay off debt with cold hard cash, not accounting profits. While Okamura has net cash on its balance sheet, it's still worth taking a look at its ability to convert earnings before interest and tax (EBIT) to free cash flow, to help us understand how quickly it is building (or eroding) that cash balance. In the last three years, Okamura created free cash flow amounting to 12% of its EBIT, an uninspiring performance. That limp level of cash conversion undermines its ability to manage and pay down debt.
Summing Up
While we empathize with investors who find debt concerning, you should keep in mind that Okamura has net cash of JP¥18.4b, as well as more liquid assets than liabilities. And we liked the look of last year's 54% year-on-year EBIT growth. So we don't think Okamura's use of debt is risky. There's no doubt that we learn most about debt from the balance sheet. However, not all investment risk resides within the balance sheet - far from it. Be aware that Okamura is showing 1 warning sign in our investment analysis , you should know about...
If you're interested in investing in businesses that can grow profits without the burden of debt, then check out this free list of growing businesses that have net cash on the balance sheet.
New: AI Stock Screener & Alerts
Our new AI Stock Screener scans the market every day to uncover opportunities.
• Dividend Powerhouses (3%+ Yield)
• Undervalued Small Caps with Insider Buying
• High growth Tech and AI Companies
Or build your own from over 50 metrics.
Have feedback on this article? Concerned about the content? Get in touch with us directly. Alternatively, email editorial-team (at) simplywallst.com.
This article by Simply Wall St is general in nature. We provide commentary based on historical data and analyst forecasts only using an unbiased methodology and our articles are not intended to be financial advice. It does not constitute a recommendation to buy or sell any stock, and does not take account of your objectives, or your financial situation. We aim to bring you long-term focused analysis driven by fundamental data. Note that our analysis may not factor in the latest price-sensitive company announcements or qualitative material. Simply Wall St has no position in any stocks mentioned.
About TSE:7994
Okamura
Manufactures, sells, distributes, and installs office furniture, store displays, material handling systems, and industrial machinery in Japan.
Very undervalued established dividend payer.
Similar Companies
Market Insights

Advertisement
Community Narratives
Groundbreaking therapies that could change the treatment landscape for PTSD, fibromyalgia, MS & Alzheimer’s
Fair Value US$6.20|86.9% undervalued
CM
Community Contributor
DigitalOcean Will Grow 14% by Embracing AI with Paperspace Acquisition
Fair Value US$50.00|42.8% undervalued
NE
Community Contributor
Viant Technology: A Rising AdTech Challenger in the AI-Powered CTV Market
Fair Value US$38.61|66.0% undervalued
BL
Community Contributor
Volvo will Accelerate Forward into Electric and Autonomous Leadership in Five Years
Fair Value SEK 438.80|40.8% undervalued
UN
Community Contributor