- Japan
- /
- Professional Services
- /
- TSE:7049
These 4 Measures Indicate That SHIKIGAKU (TSE:7049) Is Using Debt Reasonably Well


Some say volatility, rather than debt, is the best way to think about risk as an investor, but Warren Buffett famously said that 'Volatility is far from synonymous with risk.' It's only natural to consider a company's balance sheet when you examine how risky it is, since debt is often involved when a business collapses. Importantly, SHIKIGAKU. Co., Ltd. (TSE:7049) does carry debt. But the more important question is: how much risk is that debt creating?
What Risk Does Debt Bring?
Debt assists a business until the business has trouble paying it off, either with new capital or with free cash flow. If things get really bad, the lenders can take control of the business. However, a more frequent (but still costly) occurrence is where a company must issue shares at bargain-basement prices, permanently diluting shareholders, just to shore up its balance sheet. Of course, the upside of debt is that it often represents cheap capital, especially when it replaces dilution in a company with the ability to reinvest at high rates of return. The first step when considering a company's debt levels is to consider its cash and debt together.
Check out our latest analysis for SHIKIGAKU
What Is SHIKIGAKU's Debt?
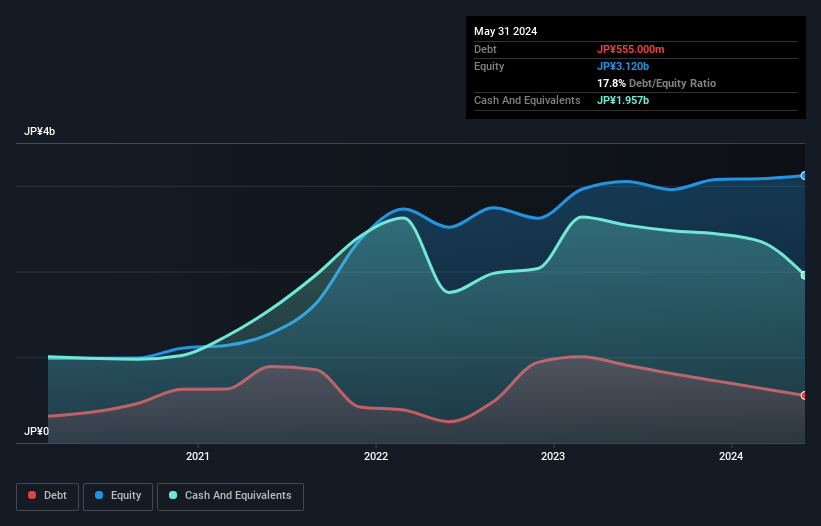
You can click the graphic below for the historical numbers, but it shows that SHIKIGAKU had JP¥555.0m of debt in May 2024, down from JP¥907.0m, one year before. But it also has JP¥1.96b in cash to offset that, meaning it has JP¥1.40b net cash.
How Healthy Is SHIKIGAKU's Balance Sheet?
The latest balance sheet data shows that SHIKIGAKU had liabilities of JP¥1.12b due within a year, and liabilities of JP¥265.0m falling due after that. On the other hand, it had cash of JP¥1.96b and JP¥1.37b worth of receivables due within a year. So it can boast JP¥1.95b more liquid assets than total liabilities.
This excess liquidity is a great indication that SHIKIGAKU's balance sheet is almost as strong as Fort Knox. Having regard to this fact, we think its balance sheet is as strong as an ox. Simply put, the fact that SHIKIGAKU has more cash than debt is arguably a good indication that it can manage its debt safely.
It was also good to see that despite losing money on the EBIT line last year, SHIKIGAKU turned things around in the last 12 months, delivering and EBIT of JP¥124m. The balance sheet is clearly the area to focus on when you are analysing debt. But ultimately the future profitability of the business will decide if SHIKIGAKU can strengthen its balance sheet over time. So if you're focused on the future you can check out this free report showing analyst profit forecasts.
Finally, while the tax-man may adore accounting profits, lenders only accept cold hard cash. While SHIKIGAKU has net cash on its balance sheet, it's still worth taking a look at its ability to convert earnings before interest and tax (EBIT) to free cash flow, to help us understand how quickly it is building (or eroding) that cash balance. During the last year, SHIKIGAKU burned a lot of cash. While that may be a result of expenditure for growth, it does make the debt far more risky.
Summing Up
While we empathize with investors who find debt concerning, you should keep in mind that SHIKIGAKU has net cash of JP¥1.40b, as well as more liquid assets than liabilities. So we are not troubled with SHIKIGAKU's debt use. When analysing debt levels, the balance sheet is the obvious place to start. But ultimately, every company can contain risks that exist outside of the balance sheet. For example, we've discovered 3 warning signs for SHIKIGAKU that you should be aware of before investing here.
At the end of the day, it's often better to focus on companies that are free from net debt. You can access our special list of such companies (all with a track record of profit growth). It's free.
New: Manage All Your Stock Portfolios in One Place
We've created the ultimate portfolio companion for stock investors, and it's free.
• Connect an unlimited number of Portfolios and see your total in one currency
• Be alerted to new Warning Signs or Risks via email or mobile
• Track the Fair Value of your stocks
Have feedback on this article? Concerned about the content? Get in touch with us directly. Alternatively, email editorial-team (at) simplywallst.com.
This article by Simply Wall St is general in nature. We provide commentary based on historical data and analyst forecasts only using an unbiased methodology and our articles are not intended to be financial advice. It does not constitute a recommendation to buy or sell any stock, and does not take account of your objectives, or your financial situation. We aim to bring you long-term focused analysis driven by fundamental data. Note that our analysis may not factor in the latest price-sensitive company announcements or qualitative material. Simply Wall St has no position in any stocks mentioned.
Have feedback on this article? Concerned about the content? Get in touch with us directly. Alternatively, email editorial-team@simplywallst.com
About TSE:7049
SHIKIGAKU
Provides management and organization consulting services for employees.
Excellent balance sheet and slightly overvalued.
Market Insights

Community Narratives


