- Japan
- /
- Professional Services
- /
- TSE:4194
Visional, Inc. Just Beat Earnings Expectations: Here's What Analysts Think Will Happen Next


Visional, Inc. (TSE:4194) shareholders are probably feeling a little disappointed, since its shares fell 5.0% to JP¥8,640 in the week after its latest yearly results. Visional reported JP¥66b in revenue, roughly in line with analyst forecasts, although statutory earnings per share (EPS) of JP¥331 beat expectations, being 5.3% higher than what the analysts expected. This is an important time for investors, as they can track a company's performance in its report, look at what experts are forecasting for next year, and see if there has been any change to expectations for the business. So we gathered the latest post-earnings forecasts to see what estimates suggest is in store for next year.
See our latest analysis for Visional
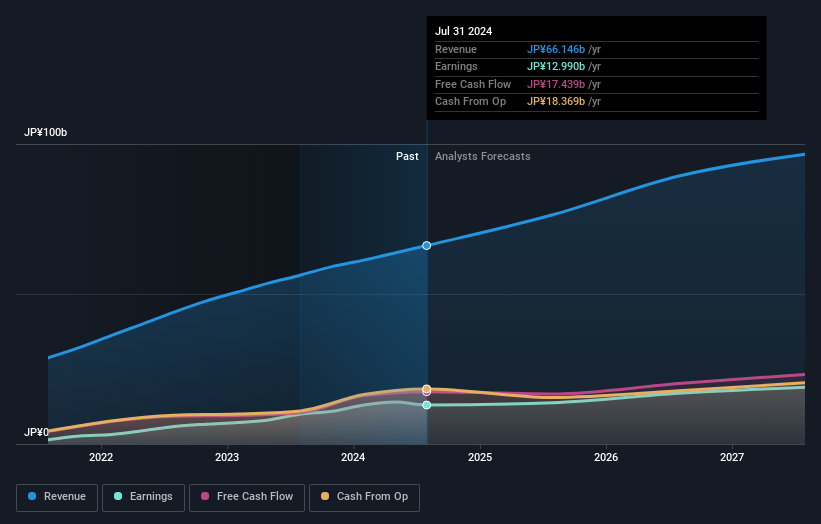
After the latest results, the eight analysts covering Visional are now predicting revenues of JP¥76.4b in 2025. If met, this would reflect a meaningful 15% improvement in revenue compared to the last 12 months. Statutory earnings per share are predicted to increase 6.9% to JP¥350. Yet prior to the latest earnings, the analysts had been anticipated revenues of JP¥77.2b and earnings per share (EPS) of JP¥356 in 2025. The consensus analysts don't seem to have seen anything in these results that would have changed their view on the business, given there's been no major change to their estimates.
It will come as no surprise then, to learn that the consensus price target is largely unchanged at JP¥9,904. The consensus price target is just an average of individual analyst targets, so - it could be handy to see how wide the range of underlying estimates is. There are some variant perceptions on Visional, with the most bullish analyst valuing it at JP¥11,130 and the most bearish at JP¥8,200 per share. Even so, with a relatively close grouping of estimates, it looks like the analysts are quite confident in their valuations, suggesting Visional is an easy business to forecast or the the analysts are all using similar assumptions.
Taking a look at the bigger picture now, one of the ways we can understand these forecasts is to see how they compare to both past performance and industry growth estimates. We would highlight that Visional's revenue growth is expected to slow, with the forecast 15% annualised growth rate until the end of 2025 being well below the historical 25% p.a. growth over the last three years. Juxtapose this against the other companies in the industry with analyst coverage, which are forecast to grow their revenues (in aggregate) 6.1% per year. So it's pretty clear that, while Visional's revenue growth is expected to slow, it's still expected to grow faster than the industry itself.
The Bottom Line
The most important thing to take away is that there's been no major change in sentiment, with the analysts reconfirming that the business is performing in line with their previous earnings per share estimates. Fortunately, they also reconfirmed their revenue numbers, suggesting that it's tracking in line with expectations. Additionally, our data suggests that revenue is expected to grow faster than the wider industry. There was no real change to the consensus price target, suggesting that the intrinsic value of the business has not undergone any major changes with the latest estimates.
Following on from that line of thought, we think that the long-term prospects of the business are much more relevant than next year's earnings. At Simply Wall St, we have a full range of analyst estimates for Visional going out to 2027, and you can see them free on our platform here..
Another thing to consider is whether management and directors have been buying or selling stock recently. We provide an overview of all open market stock trades for the last twelve months on our platform, here.
New: Manage All Your Stock Portfolios in One Place
We've created the ultimate portfolio companion for stock investors, and it's free.
• Connect an unlimited number of Portfolios and see your total in one currency
• Be alerted to new Warning Signs or Risks via email or mobile
• Track the Fair Value of your stocks
Have feedback on this article? Concerned about the content? Get in touch with us directly. Alternatively, email editorial-team (at) simplywallst.com.
This article by Simply Wall St is general in nature. We provide commentary based on historical data and analyst forecasts only using an unbiased methodology and our articles are not intended to be financial advice. It does not constitute a recommendation to buy or sell any stock, and does not take account of your objectives, or your financial situation. We aim to bring you long-term focused analysis driven by fundamental data. Note that our analysis may not factor in the latest price-sensitive company announcements or qualitative material. Simply Wall St has no position in any stocks mentioned.
About TSE:4194
Solid track record with reasonable growth potential.
Market Insights

Community Narratives
