
Advertisement
- Japan
- /
- Professional Services
- /
- TSE:2181
Capital Investments At Persol HoldingsLtd (TSE:2181) Point To A Promising Future
If you're looking for a multi-bagger, there's a few things to keep an eye out for. Ideally, a business will show two trends; firstly a growing return on capital employed (ROCE) and secondly, an increasing amount of capital employed. This shows us that it's a compounding machine, able to continually reinvest its earnings back into the business and generate higher returns. That's why when we briefly looked at Persol HoldingsLtd's (TSE:2181) ROCE trend, we were very happy with what we saw.
Return On Capital Employed (ROCE): What Is It?
For those that aren't sure what ROCE is, it measures the amount of pre-tax profits a company can generate from the capital employed in its business. Analysts use this formula to calculate it for Persol HoldingsLtd:
Return on Capital Employed = Earnings Before Interest and Tax (EBIT) ÷ (Total Assets - Current Liabilities)
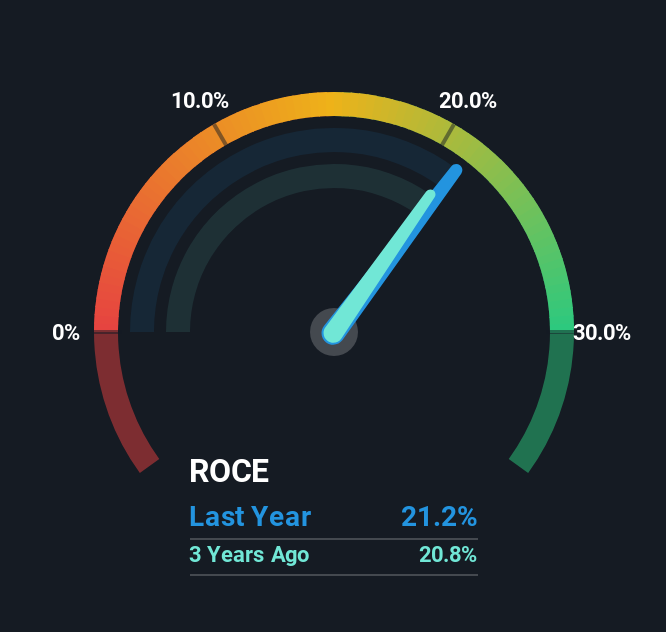
0.21 = JP¥56b ÷ (JP¥545b - JP¥281b) (Based on the trailing twelve months to June 2025).
So, Persol HoldingsLtd has an ROCE of 21%. On its own, that's a very good return and it's on par with the returns earned by companies in a similar industry.
View our latest analysis for Persol HoldingsLtd
In the above chart we have measured Persol HoldingsLtd's prior ROCE against its prior performance, but the future is arguably more important. If you're interested, you can view the analysts predictions in our free analyst report for Persol HoldingsLtd .
What Can We Tell From Persol HoldingsLtd's ROCE Trend?
In terms of Persol HoldingsLtd's history of ROCE, it's quite impressive. Over the past five years, ROCE has remained relatively flat at around 21% and the business has deployed 23% more capital into its operations. Now considering ROCE is an attractive 21%, this combination is actually pretty appealing because it means the business can consistently put money to work and generate these high returns. You'll see this when looking at well operated businesses or favorable business models.
On another note, while the change in ROCE trend might not scream for attention, it's interesting that the current liabilities have actually gone up over the last five years. This is intriguing because if current liabilities hadn't increased to 52% of total assets, this reported ROCE would probably be less than21% because total capital employed would be higher.The 21% ROCE could be even lower if current liabilities weren't 52% of total assets, because the the formula would show a larger base of total capital employed. Additionally, this high level of current liabilities isn't ideal because it means the company's suppliers (or short-term creditors) are effectively funding a large portion of the business.
Our Take On Persol HoldingsLtd's ROCE
In summary, we're delighted to see that Persol HoldingsLtd has been compounding returns by reinvesting at consistently high rates of return, as these are common traits of a multi-bagger. And since the stock has risen strongly over the last five years, it appears the market might expect this trend to continue. So while the positive underlying trends may be accounted for by investors, we still think this stock is worth looking into further.
Persol HoldingsLtd does have some risks though, and we've spotted 1 warning sign for Persol HoldingsLtd that you might be interested in.
If you want to search for more stocks that have been earning high returns, check out this free list of stocks with solid balance sheets that are also earning high returns on equity.
New: Manage All Your Stock Portfolios in One Place
We've created the ultimate portfolio companion for stock investors, and it's free.
• Connect an unlimited number of Portfolios and see your total in one currency
• Be alerted to new Warning Signs or Risks via email or mobile
• Track the Fair Value of your stocks
Have feedback on this article? Concerned about the content? Get in touch with us directly. Alternatively, email editorial-team (at) simplywallst.com.
This article by Simply Wall St is general in nature. We provide commentary based on historical data and analyst forecasts only using an unbiased methodology and our articles are not intended to be financial advice. It does not constitute a recommendation to buy or sell any stock, and does not take account of your objectives, or your financial situation. We aim to bring you long-term focused analysis driven by fundamental data. Note that our analysis may not factor in the latest price-sensitive company announcements or qualitative material. Simply Wall St has no position in any stocks mentioned.
About TSE:2181
Persol HoldingsLtd
Provides human resource services under the PERSOL brand worldwide.
Flawless balance sheet, undervalued and pays a dividend.
Similar Companies
Market Insights

Advertisement
Community Narratives
Kodiak AI - a potential 100 bagger opportunity?
Fair Value US$14.00|41.9% undervalued
DA
Community Contributor
A Fair Price for a Great Business Facing Real Threats
Fair Value US$383.06|14.1% undervalued
IM
Community Contributor
AXON And Shopify Integration Will Unlock Global Mobile Advertising
Fair Value US$613.59|1.2% undervalued
AN
Based on Analyst Price Targets