
Advertisement
The external fund manager backed by Berkshire Hathaway's Charlie Munger, Li Lu, makes no bones about it when he says 'The biggest investment risk is not the volatility of prices, but whether you will suffer a permanent loss of capital.' So it might be obvious that you need to consider debt, when you think about how risky any given stock is, because too much debt can sink a company. We note that Open Up Group Inc. (TSE:2154) does have debt on its balance sheet. But should shareholders be worried about its use of debt?
What Risk Does Debt Bring?
Debt assists a business until the business has trouble paying it off, either with new capital or with free cash flow. If things get really bad, the lenders can take control of the business. However, a more usual (but still expensive) situation is where a company must dilute shareholders at a cheap share price simply to get debt under control. Of course, the upside of debt is that it often represents cheap capital, especially when it replaces dilution in a company with the ability to reinvest at high rates of return. When we think about a company's use of debt, we first look at cash and debt together.
Check out our latest analysis for Open Up Group
What Is Open Up Group's Debt?
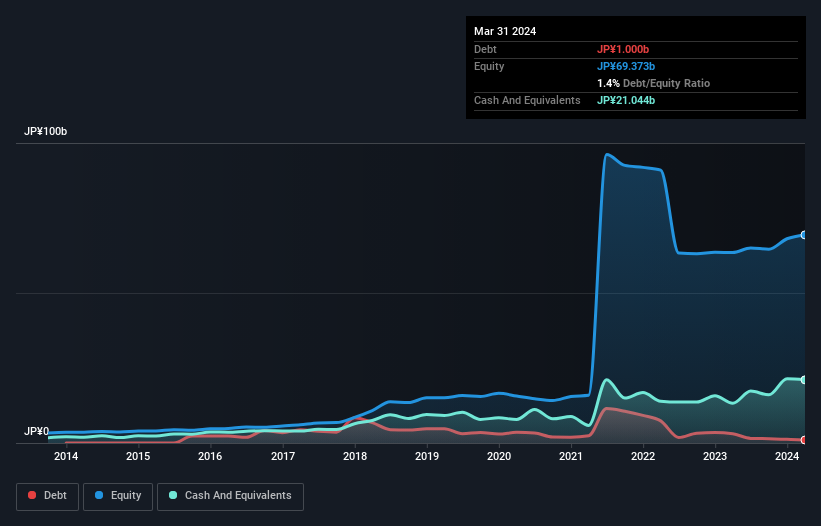
The image below, which you can click on for greater detail, shows that Open Up Group had debt of JP¥1.00b at the end of March 2024, a reduction from JP¥3.08b over a year. However, it does have JP¥21.0b in cash offsetting this, leading to net cash of JP¥20.0b.
How Strong Is Open Up Group's Balance Sheet?
According to the last reported balance sheet, Open Up Group had liabilities of JP¥31.6b due within 12 months, and liabilities of JP¥6.28b due beyond 12 months. Offsetting this, it had JP¥21.0b in cash and JP¥22.5b in receivables that were due within 12 months. So it actually has JP¥5.64b more liquid assets than total liabilities.
This short term liquidity is a sign that Open Up Group could probably pay off its debt with ease, as its balance sheet is far from stretched. Succinctly put, Open Up Group boasts net cash, so it's fair to say it does not have a heavy debt load!
In fact Open Up Group's saving grace is its low debt levels, because its EBIT has tanked 22% in the last twelve months. Falling earnings (if the trend continues) could eventually make even modest debt quite risky. There's no doubt that we learn most about debt from the balance sheet. But it is future earnings, more than anything, that will determine Open Up Group's ability to maintain a healthy balance sheet going forward. So if you're focused on the future you can check out this free report showing analyst profit forecasts.
But our final consideration is also important, because a company cannot pay debt with paper profits; it needs cold hard cash. Open Up Group may have net cash on the balance sheet, but it is still interesting to look at how well the business converts its earnings before interest and tax (EBIT) to free cash flow, because that will influence both its need for, and its capacity to manage debt. Over the last three years, Open Up Group actually produced more free cash flow than EBIT. There's nothing better than incoming cash when it comes to staying in your lenders' good graces.
Summing Up
While it is always sensible to investigate a company's debt, in this case Open Up Group has JP¥20.0b in net cash and a decent-looking balance sheet. And it impressed us with free cash flow of JP¥19b, being 136% of its EBIT. So we don't have any problem with Open Up Group's use of debt. There's no doubt that we learn most about debt from the balance sheet. However, not all investment risk resides within the balance sheet - far from it. For instance, we've identified 1 warning sign for Open Up Group that you should be aware of.
Of course, if you're the type of investor who prefers buying stocks without the burden of debt, then don't hesitate to discover our exclusive list of net cash growth stocks, today.
New: AI Stock Screener & Alerts
Our new AI Stock Screener scans the market every day to uncover opportunities.
• Dividend Powerhouses (3%+ Yield)
• Undervalued Small Caps with Insider Buying
• High growth Tech and AI Companies
Or build your own from over 50 metrics.
Have feedback on this article? Concerned about the content? Get in touch with us directly. Alternatively, email editorial-team (at) simplywallst.com.
This article by Simply Wall St is general in nature. We provide commentary based on historical data and analyst forecasts only using an unbiased methodology and our articles are not intended to be financial advice. It does not constitute a recommendation to buy or sell any stock, and does not take account of your objectives, or your financial situation. We aim to bring you long-term focused analysis driven by fundamental data. Note that our analysis may not factor in the latest price-sensitive company announcements or qualitative material. Simply Wall St has no position in any stocks mentioned.
Have feedback on this article? Concerned about the content? Get in touch with us directly. Alternatively, email editorial-team@simplywallst.com
About TSE:2154
Open Up Group
Engages in the engineer staffing businesses for manufacturers, general contractors, and IT companies in Japan and internationally.
Flawless balance sheet established dividend payer.
Similar Companies
Market Insights

Advertisement
Community Narratives
MINISO's fair value is projected at 26.69 with an anticipated PE ratio shift of 20x
Fair Value US$24.03|11.0% undervalued
BE
Community Contributor
Procter & Gamble: A Dividend Giant Facing Slowing Growth
Fair Value US$119.81|23.3% overvalued
AN
Community Contributor
Eli Lilly's Future Growth Driven by Tirzepatide and Favorable Market Conditions
Fair Value US$1.19k|13.8% undervalued
EA
Community Contributor