

Warren Buffett famously said, 'Volatility is far from synonymous with risk.' When we think about how risky a company is, we always like to look at its use of debt, since debt overload can lead to ruin. We note that Fujii Sangyo Corporation (TSE:9906) does have debt on its balance sheet. But the more important question is: how much risk is that debt creating?
What Risk Does Debt Bring?
Debt is a tool to help businesses grow, but if a business is incapable of paying off its lenders, then it exists at their mercy. In the worst case scenario, a company can go bankrupt if it cannot pay its creditors. While that is not too common, we often do see indebted companies permanently diluting shareholders because lenders force them to raise capital at a distressed price. Of course, the upside of debt is that it often represents cheap capital, especially when it replaces dilution in a company with the ability to reinvest at high rates of return. When we examine debt levels, we first consider both cash and debt levels, together.
See our latest analysis for Fujii Sangyo
What Is Fujii Sangyo's Debt?
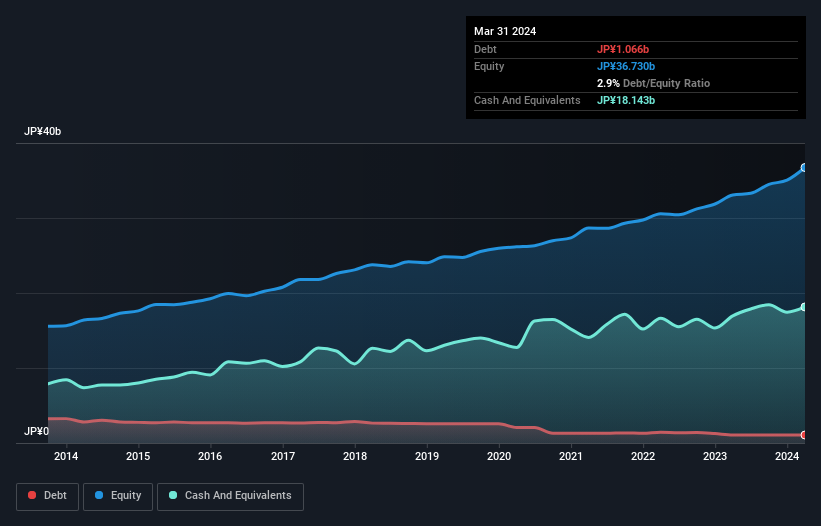
As you can see below, Fujii Sangyo had JP¥1.07b of debt, at March 2024, which is about the same as the year before. You can click the chart for greater detail. But it also has JP¥18.1b in cash to offset that, meaning it has JP¥17.1b net cash.
How Strong Is Fujii Sangyo's Balance Sheet?
Zooming in on the latest balance sheet data, we can see that Fujii Sangyo had liabilities of JP¥25.2b due within 12 months and liabilities of JP¥2.71b due beyond that. Offsetting this, it had JP¥18.1b in cash and JP¥25.3b in receivables that were due within 12 months. So it can boast JP¥15.5b more liquid assets than total liabilities.
This luscious liquidity implies that Fujii Sangyo's balance sheet is sturdy like a giant sequoia tree. Having regard to this fact, we think its balance sheet is as strong as an ox. Succinctly put, Fujii Sangyo boasts net cash, so it's fair to say it does not have a heavy debt load!
On top of that, Fujii Sangyo grew its EBIT by 35% over the last twelve months, and that growth will make it easier to handle its debt. The balance sheet is clearly the area to focus on when you are analysing debt. But you can't view debt in total isolation; since Fujii Sangyo will need earnings to service that debt. So when considering debt, it's definitely worth looking at the earnings trend. Click here for an interactive snapshot.
But our final consideration is also important, because a company cannot pay debt with paper profits; it needs cold hard cash. While Fujii Sangyo has net cash on its balance sheet, it's still worth taking a look at its ability to convert earnings before interest and tax (EBIT) to free cash flow, to help us understand how quickly it is building (or eroding) that cash balance. Over the most recent three years, Fujii Sangyo recorded free cash flow worth 50% of its EBIT, which is around normal, given free cash flow excludes interest and tax. This free cash flow puts the company in a good position to pay down debt, when appropriate.
Summing Up
While we empathize with investors who find debt concerning, you should keep in mind that Fujii Sangyo has net cash of JP¥17.1b, as well as more liquid assets than liabilities. And we liked the look of last year's 35% year-on-year EBIT growth. The bottom line is that we do not find Fujii Sangyo's debt levels at all concerning. Another positive for shareholders is that it pays dividends. So if you like receiving those dividend payments, check Fujii Sangyo's dividend history, without delay!
When all is said and done, sometimes its easier to focus on companies that don't even need debt. Readers can access a list of growth stocks with zero net debt 100% free, right now.
If you're looking to trade Fujii Sangyo, open an account with the lowest-cost platform trusted by professionals, Interactive Brokers.
With clients in over 200 countries and territories, and access to 160 markets, IBKR lets you trade stocks, options, futures, forex, bonds and funds from a single integrated account.
Enjoy no hidden fees, no account minimums, and FX conversion rates as low as 0.03%, far better than what most brokers offer.
Sponsored ContentNew: AI Stock Screener & Alerts
Our new AI Stock Screener scans the market every day to uncover opportunities.
• Dividend Powerhouses (3%+ Yield)
• Undervalued Small Caps with Insider Buying
• High growth Tech and AI Companies
Or build your own from over 50 metrics.
Have feedback on this article? Concerned about the content? Get in touch with us directly. Alternatively, email editorial-team (at) simplywallst.com.
This article by Simply Wall St is general in nature. We provide commentary based on historical data and analyst forecasts only using an unbiased methodology and our articles are not intended to be financial advice. It does not constitute a recommendation to buy or sell any stock, and does not take account of your objectives, or your financial situation. We aim to bring you long-term focused analysis driven by fundamental data. Note that our analysis may not factor in the latest price-sensitive company announcements or qualitative material. Simply Wall St has no position in any stocks mentioned.
Have feedback on this article? Concerned about the content? Get in touch with us directly. Alternatively, email editorial-team@simplywallst.com
About TSE:9906
Fujii Sangyo
Engages in the sale of electrical construction materials, electrical equipment, machine tools, information equipment, and civil engineering and construction machinery in Japan.
Flawless balance sheet 6 star dividend payer.
Market Insights

Community Narratives

