Advertisement
- Japan
- /
- Construction
- /
- TSE:9765
Ohba (TSE:9765) Margin Decline Undercuts Bullish Profitability Narratives

Simply Wall St
Reviewed by Simply Wall St
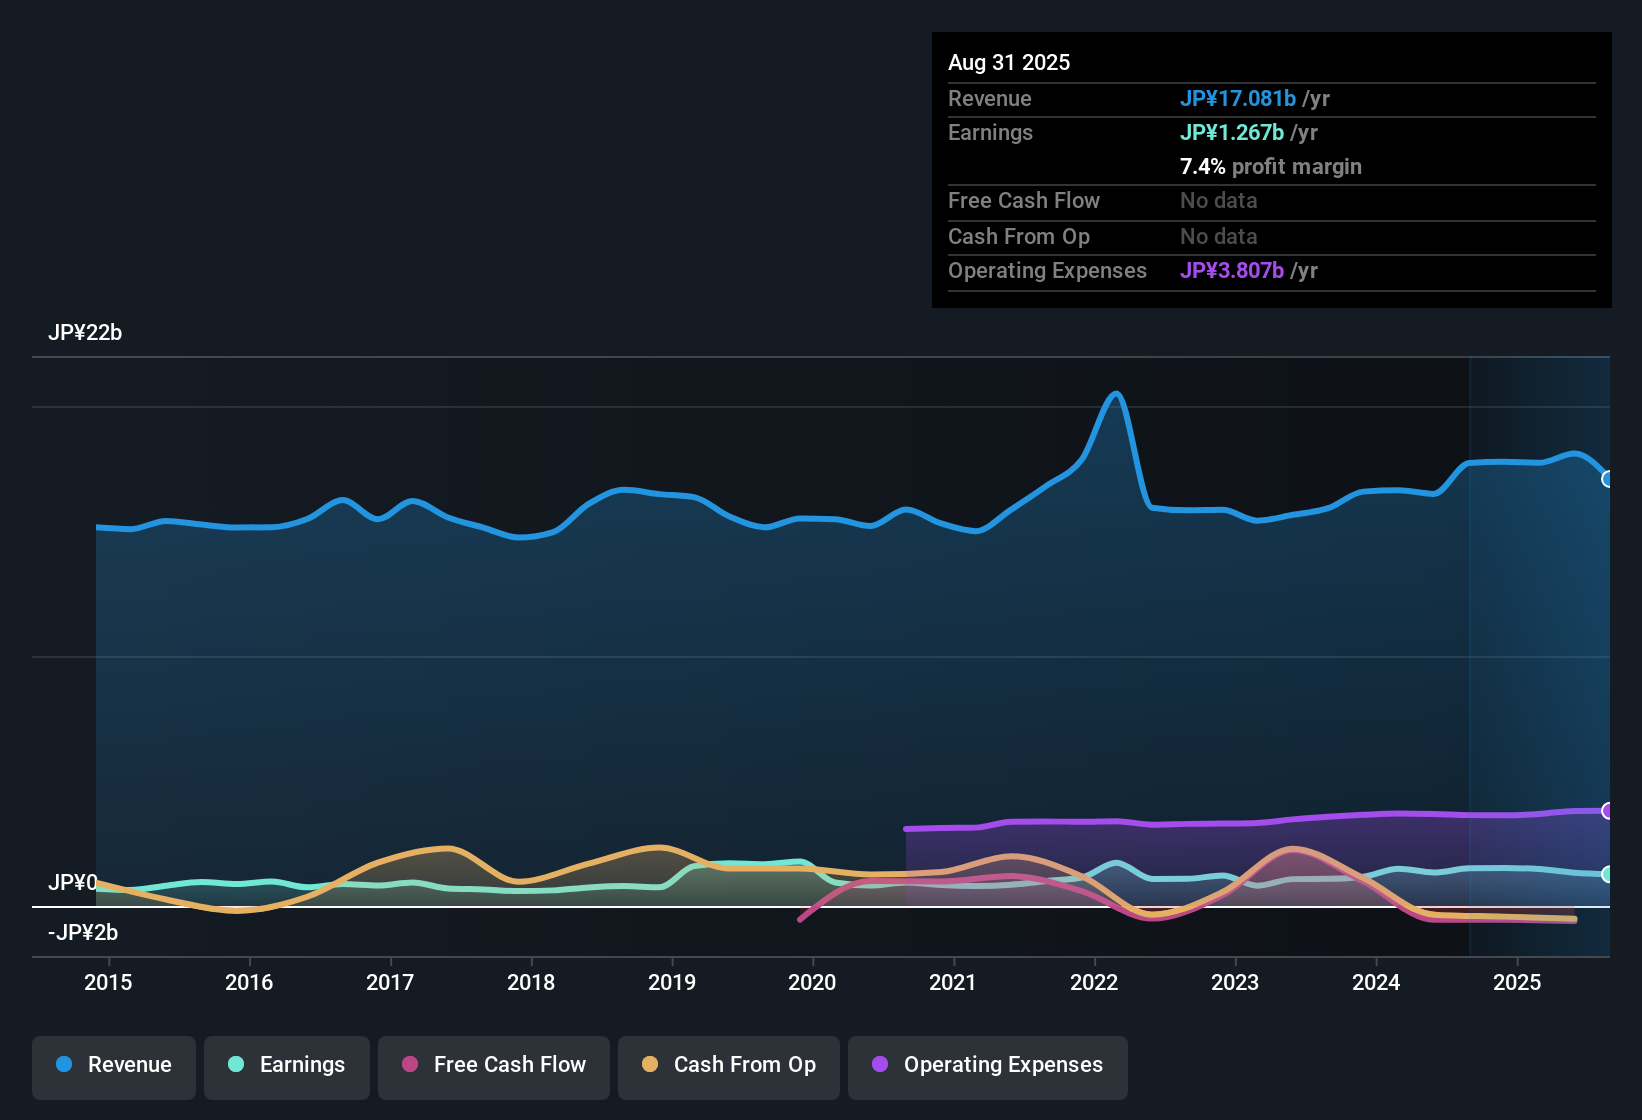
Ohba (TSE:9765) posted a net profit margin of 7.4%, down from 8.5% in the prior year, while its Price-to-Earnings Ratio is 13.6x. Over the last five years, the company recorded an average annual earnings growth of 9.3%, but the most recent earnings growth has turned negative, breaking the positive multi-year trend. Investors will see high-quality earnings and solid long-term growth as key strengths, even as they keep an eye on compressed margins and recent short-term headwinds.
See our full analysis for Ohba.Next, we will compare these latest results with the popular market narratives to see which storylines hold up and where the new numbers might surprise.
Curious how numbers become stories that shape markets? Explore Community Narratives
Long-Term Earnings Growth Remains a Bright Spot
- Ohba posted an average annual earnings growth rate of 9.3% over the last five years, a figure that stands out compared to its short-term reversal into negative earnings growth this year.
- While recent results show a setback, the prevailing market view heavily supports the significance of Ohba's long history of high-quality, consistent earnings. This track record still signals a resilient business model.
- Critics highlight that the current decline breaks a multi-year positive streak, which means new buyers may approach with caution.
- Yet, the steady 5-year growth rate reassures many that the core strength of the company extends beyond this year's dip.
Profit Margins Under Pressure as Trends Shift
- The net profit margin decreased to 7.4% from 8.5% last year, underscoring that cost pressures or revenue dynamics are compressing profitability more than before.
- Prevailing market analysis often spotlights margin stability as a key quality. However, the extent of the drop challenges the notion that Ohba’s profitability is immune to short-term operational headwinds.
- Although bulls frequently turn to high-quality earnings as a defense, the margin decline puts a spotlight on execution risk that can't be dismissed lightly.
- The ongoing margin pressure will be critical for investors monitoring whether this is a temporary challenge or a shifting baseline for Ohba's business model.
Valuation Premium Reaches Beyond DCF Fair Value
- Ohba currently trades at ¥1,084 per share, not only above the Japan Construction industry average P/E of 12x (vs Ohba’s 13.6x), but also carrying a premium to its DCF fair value of ¥650.14.
- Prevailing market discussion underscores that while one valuation metric shows Ohba as relatively attractive versus some listed peers, the significant share price gap to DCF fair value challenges claims of a bargain. This makes valuation a divisive talking point for both optimistic and cautious investors.
- Bulls point to at least one metric showing good value, but critics question just how much long-term growth is already priced into shares trading at this premium.
- With the DCF gap this wide, even positive long-term fundamentals must be balanced against the risk of overpaying at current levels.
Next Steps
Don't just look at this quarter; the real story is in the long-term trend. We've done an in-depth analysis on Ohba's growth and its valuation to see if today's price is a bargain. Add the company to your watchlist or portfolio now so you don't miss the next big move.
See What Else Is Out There
Ohba’s premium valuation and recent reversal in earnings growth raise concerns about paying too much for shares that may not deliver consistent returns.
If you want more consistency and confidence in the numbers, use stable growth stocks screener to focus on stocks that keep performing steadily even when trends shift.
This article by Simply Wall St is general in nature. We provide commentary based on historical data and analyst forecasts only using an unbiased methodology and our articles are not intended to be financial advice. It does not constitute a recommendation to buy or sell any stock, and does not take account of your objectives, or your financial situation. We aim to bring you long-term focused analysis driven by fundamental data. Note that our analysis may not factor in the latest price-sensitive company announcements or qualitative material. Simply Wall St has no position in any stocks mentioned.
New: AI Stock Screener & Alerts
Our new AI Stock Screener scans the market every day to uncover opportunities.
• Dividend Powerhouses (3%+ Yield)
• Undervalued Small Caps with Insider Buying
• High growth Tech and AI Companies
Or build your own from over 50 metrics.
Have feedback on this article? Concerned about the content? Get in touch with us directly. Alternatively, email editorial-team@simplywallst.com
About TSE:9765
Established dividend payer with adequate balance sheet.
Market Insights

Advertisement
Community Narratives
Finding The True Value Of A Logistics Powerhouse
Fair Value US$95.21|8.7% undervalued
NV
Community Contributor
Paradigm Biopharmaceuticals Will Lead Osteoarthritis Treatment with Zilosul's FDA Success
Fair Value AU$5.50|93.3% undervalued
AM
Community Contributor
Barrick Mining (ABX:CA): A Gold Hedge against a U.S. Shutdown
Fair Value CA$60.00|18.7% undervalued
GM
Community Contributor