

Key Insights
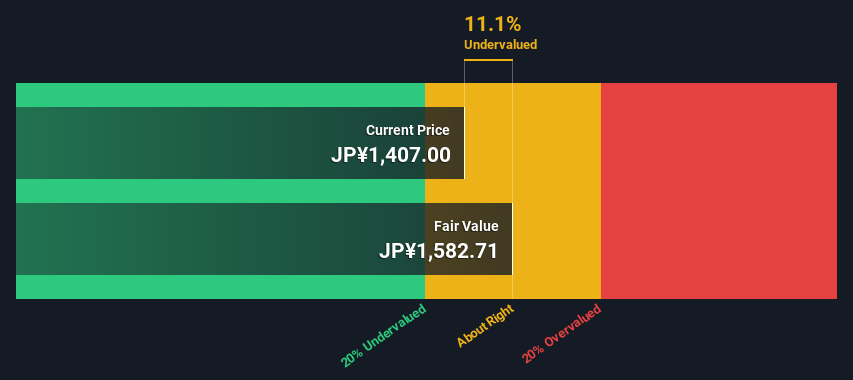
- Kanaden's estimated fair value is JP¥1,583 based on 2 Stage Free Cash Flow to Equity
- With JP¥1,407 share price, Kanaden appears to be trading close to its estimated fair value
In this article we are going to estimate the intrinsic value of Kanaden Corporation (TSE:8081) by taking the expected future cash flows and discounting them to their present value. The Discounted Cash Flow (DCF) model is the tool we will apply to do this. Believe it or not, it's not too difficult to follow, as you'll see from our example!
We would caution that there are many ways of valuing a company and, like the DCF, each technique has advantages and disadvantages in certain scenarios. If you still have some burning questions about this type of valuation, take a look at the Simply Wall St analysis model.
We've discovered 1 warning sign about Kanaden. View them for free.The Model
We are going to use a two-stage DCF model, which, as the name states, takes into account two stages of growth. The first stage is generally a higher growth period which levels off heading towards the terminal value, captured in the second 'steady growth' period. In the first stage we need to estimate the cash flows to the business over the next ten years. Seeing as no analyst estimates of free cash flow are available to us, we have extrapolate the previous free cash flow (FCF) from the company's last reported value. We assume companies with shrinking free cash flow will slow their rate of shrinkage, and that companies with growing free cash flow will see their growth rate slow, over this period. We do this to reflect that growth tends to slow more in the early years than it does in later years.
Generally we assume that a dollar today is more valuable than a dollar in the future, so we discount the value of these future cash flows to their estimated value in today's dollars:
10-year free cash flow (FCF) forecast
| 2025 | 2026 | 2027 | 2028 | 2029 | 2030 | 2031 | 2032 | 2033 | 2034 | |
| Levered FCF (¥, Millions) | JP¥1.82b | JP¥1.85b | JP¥1.87b | JP¥1.89b | JP¥1.90b | JP¥1.91b | JP¥1.92b | JP¥1.93b | JP¥1.94b | JP¥1.95b |
| Growth Rate Estimate Source | Est @ 1.87% | Est @ 1.42% | Est @ 1.11% | Est @ 0.88% | Est @ 0.73% | Est @ 0.62% | Est @ 0.55% | Est @ 0.49% | Est @ 0.46% | Est @ 0.43% |
| Present Value (¥, Millions) Discounted @ 5.7% | JP¥1.7k | JP¥1.7k | JP¥1.6k | JP¥1.5k | JP¥1.4k | JP¥1.4k | JP¥1.3k | JP¥1.2k | JP¥1.2k | JP¥1.1k |
("Est" = FCF growth rate estimated by Simply Wall St)
Present Value of 10-year Cash Flow (PVCF) = JP¥14b
The second stage is also known as Terminal Value, this is the business's cash flow after the first stage. For a number of reasons a very conservative growth rate is used that cannot exceed that of a country's GDP growth. In this case we have used the 5-year average of the 10-year government bond yield (0.4%) to estimate future growth. In the same way as with the 10-year 'growth' period, we discount future cash flows to today's value, using a cost of equity of 5.7%.
Terminal Value (TV)= FCF2034 × (1 + g) ÷ (r – g) = JP¥1.9b× (1 + 0.4%) ÷ (5.7%– 0.4%) = JP¥37b
Present Value of Terminal Value (PVTV)= TV / (1 + r)10= JP¥37b÷ ( 1 + 5.7%)10= JP¥21b
The total value is the sum of cash flows for the next ten years plus the discounted terminal value, which results in the Total Equity Value, which in this case is JP¥35b. To get the intrinsic value per share, we divide this by the total number of shares outstanding. Relative to the current share price of JP¥1.4k, the company appears about fair value at a 11% discount to where the stock price trades currently. Remember though, that this is just an approximate valuation, and like any complex formula - garbage in, garbage out.
Important Assumptions
We would point out that the most important inputs to a discounted cash flow are the discount rate and of course the actual cash flows. You don't have to agree with these inputs, I recommend redoing the calculations yourself and playing with them. The DCF also does not consider the possible cyclicality of an industry, or a company's future capital requirements, so it does not give a full picture of a company's potential performance. Given that we are looking at Kanaden as potential shareholders, the cost of equity is used as the discount rate, rather than the cost of capital (or weighted average cost of capital, WACC) which accounts for debt. In this calculation we've used 5.7%, which is based on a levered beta of 1.010. Beta is a measure of a stock's volatility, compared to the market as a whole. We get our beta from the industry average beta of globally comparable companies, with an imposed limit between 0.8 and 2.0, which is a reasonable range for a stable business.
See our latest analysis for Kanaden
SWOT Analysis for Kanaden
- Earnings growth over the past year exceeded its 5-year average.
- Currently debt free.
- Dividends are covered by earnings and cash flows.
- Dividend is in the top 25% of dividend payers in the market.
- Earnings growth over the past year underperformed the Trade Distributors industry.
- Current share price is below our estimate of fair value.
- Lack of analyst coverage makes it difficult to determine 8081's earnings prospects.
- No apparent threats visible for 8081.
Moving On:
Although the valuation of a company is important, it is only one of many factors that you need to assess for a company. It's not possible to obtain a foolproof valuation with a DCF model. Instead the best use for a DCF model is to test certain assumptions and theories to see if they would lead to the company being undervalued or overvalued. For example, changes in the company's cost of equity or the risk free rate can significantly impact the valuation. For Kanaden, we've compiled three additional aspects you should further examine:
- Risks: Consider for instance, the ever-present spectre of investment risk. We've identified 1 warning sign with Kanaden , and understanding it should be part of your investment process.
- Other Solid Businesses: Low debt, high returns on equity and good past performance are fundamental to a strong business. Why not explore our interactive list of stocks with solid business fundamentals to see if there are other companies you may not have considered!
- Other Top Analyst Picks: Interested to see what the analysts are thinking? Take a look at our interactive list of analysts' top stock picks to find out what they feel might have an attractive future outlook!
PS. Simply Wall St updates its DCF calculation for every Japanese stock every day, so if you want to find the intrinsic value of any other stock just search here.
If you're looking to trade Kanaden, open an account with the lowest-cost platform trusted by professionals, Interactive Brokers.
With clients in over 200 countries and territories, and access to 160 markets, IBKR lets you trade stocks, options, futures, forex, bonds and funds from a single integrated account.
Enjoy no hidden fees, no account minimums, and FX conversion rates as low as 0.03%, far better than what most brokers offer.
Sponsored ContentValuation is complex, but we're here to simplify it.
Discover if Kanaden might be undervalued or overvalued with our detailed analysis, featuring fair value estimates, potential risks, dividends, insider trades, and its financial condition.
Access Free AnalysisHave feedback on this article? Concerned about the content? Get in touch with us directly. Alternatively, email editorial-team (at) simplywallst.com.
This article by Simply Wall St is general in nature. We provide commentary based on historical data and analyst forecasts only using an unbiased methodology and our articles are not intended to be financial advice. It does not constitute a recommendation to buy or sell any stock, and does not take account of your objectives, or your financial situation. We aim to bring you long-term focused analysis driven by fundamental data. Note that our analysis may not factor in the latest price-sensitive company announcements or qualitative material. Simply Wall St has no position in any stocks mentioned.
About TSE:8081
Kanaden
Operates as an electronics solutions company in Japan and internationally.
Flawless balance sheet established dividend payer.
Market Insights

Community Narratives

