

Howard Marks put it nicely when he said that, rather than worrying about share price volatility, 'The possibility of permanent loss is the risk I worry about... and every practical investor I know worries about.' When we think about how risky a company is, we always like to look at its use of debt, since debt overload can lead to ruin. Importantly, Hino Motors, Ltd. (TSE:7205) does carry debt. But the more important question is: how much risk is that debt creating?
When Is Debt Dangerous?
Debt is a tool to help businesses grow, but if a business is incapable of paying off its lenders, then it exists at their mercy. In the worst case scenario, a company can go bankrupt if it cannot pay its creditors. However, a more usual (but still expensive) situation is where a company must dilute shareholders at a cheap share price simply to get debt under control. Having said that, the most common situation is where a company manages its debt reasonably well - and to its own advantage. The first thing to do when considering how much debt a business uses is to look at its cash and debt together.
Check out our latest analysis for Hino Motors
What Is Hino Motors's Net Debt?
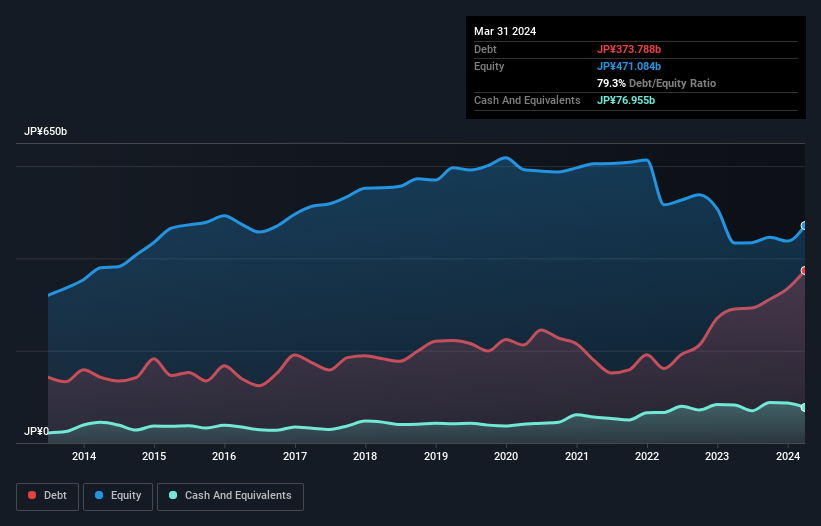
As you can see below, at the end of March 2024, Hino Motors had JP¥373.8b of debt, up from JP¥290.5b a year ago. Click the image for more detail. However, because it has a cash reserve of JP¥77.0b, its net debt is less, at about JP¥296.8b.
How Strong Is Hino Motors' Balance Sheet?
According to the last reported balance sheet, Hino Motors had liabilities of JP¥853.1b due within 12 months, and liabilities of JP¥116.2b due beyond 12 months. On the other hand, it had cash of JP¥77.0b and JP¥293.1b worth of receivables due within a year. So its liabilities outweigh the sum of its cash and (near-term) receivables by JP¥599.3b.
This deficit casts a shadow over the JP¥257.2b company, like a colossus towering over mere mortals. So we'd watch its balance sheet closely, without a doubt. At the end of the day, Hino Motors would probably need a major re-capitalization if its creditors were to demand repayment. When analysing debt levels, the balance sheet is the obvious place to start. But it is future earnings, more than anything, that will determine Hino Motors's ability to maintain a healthy balance sheet going forward. So if you're focused on the future you can check out this free report showing analyst profit forecasts.
Over 12 months, Hino Motors saw its revenue hold pretty steady, and it did not report positive earnings before interest and tax. While that hardly impresses, its not too bad either.
Caveat Emptor
Importantly, Hino Motors had an earnings before interest and tax (EBIT) loss over the last year. Indeed, it lost JP¥8.1b at the EBIT level. Considering that alongside the liabilities mentioned above make us nervous about the company. We'd want to see some strong near-term improvements before getting too interested in the stock. Not least because it had negative free cash flow of JP¥125b over the last twelve months. So suffice it to say we consider the stock to be risky. The balance sheet is clearly the area to focus on when you are analysing debt. However, not all investment risk resides within the balance sheet - far from it. For instance, we've identified 2 warning signs for Hino Motors (1 is a bit unpleasant) you should be aware of.
If you're interested in investing in businesses that can grow profits without the burden of debt, then check out this free list of growing businesses that have net cash on the balance sheet.
Valuation is complex, but we're here to simplify it.
Discover if Hino Motors might be undervalued or overvalued with our detailed analysis, featuring fair value estimates, potential risks, dividends, insider trades, and its financial condition.
Access Free AnalysisHave feedback on this article? Concerned about the content? Get in touch with us directly. Alternatively, email editorial-team (at) simplywallst.com.
This article by Simply Wall St is general in nature. We provide commentary based on historical data and analyst forecasts only using an unbiased methodology and our articles are not intended to be financial advice. It does not constitute a recommendation to buy or sell any stock, and does not take account of your objectives, or your financial situation. We aim to bring you long-term focused analysis driven by fundamental data. Note that our analysis may not factor in the latest price-sensitive company announcements or qualitative material. Simply Wall St has no position in any stocks mentioned.
About TSE:7205
Hino Motors
Manufactures and sells large commercial vehicles under the Hino brand worldwide.
Reasonable growth potential and fair value.
Similar Companies
Market Insights

Community Narratives

