- Japan
- /
- Electrical
- /
- TSE:6986
Investors Appear Satisfied With Futaba Corporation's (TSE:6986) Prospects As Shares Rocket 26%


The Futaba Corporation (TSE:6986) share price has done very well over the last month, posting an excellent gain of 26%. Looking back a bit further, it's encouraging to see the stock is up 34% in the last year.
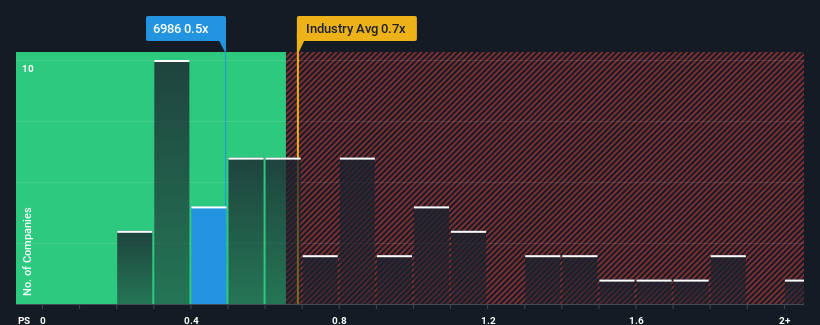
In spite of the firm bounce in price, it's still not a stretch to say that Futaba's price-to-sales (or "P/S") ratio of 0.5x right now seems quite "middle-of-the-road" compared to the Electrical industry in Japan, where the median P/S ratio is around 0.7x. However, investors might be overlooking a clear opportunity or potential setback if there is no rational basis for the P/S.
View our latest analysis for Futaba
What Does Futaba's P/S Mean For Shareholders?
For instance, Futaba's receding revenue in recent times would have to be some food for thought. Perhaps investors believe the recent revenue performance is enough to keep in line with the industry, which is keeping the P/S from dropping off. If not, then existing shareholders may be a little nervous about the viability of the share price.
Want the full picture on earnings, revenue and cash flow for the company? Then our free report on Futaba will help you shine a light on its historical performance.How Is Futaba's Revenue Growth Trending?
In order to justify its P/S ratio, Futaba would need to produce growth that's similar to the industry.
Taking a look back first, the company's revenue growth last year wasn't something to get excited about as it posted a disappointing decline of 6.6%. That put a dampener on the good run it was having over the longer-term as its three-year revenue growth is still a noteworthy 15% in total. So we can start by confirming that the company has generally done a good job of growing revenue over that time, even though it had some hiccups along the way.
It's interesting to note that the rest of the industry is similarly expected to grow by 4.1% over the next year, which is fairly even with the company's recent medium-term annualised growth rates.
With this information, we can see why Futaba is trading at a fairly similar P/S to the industry. Apparently shareholders are comfortable to simply hold on assuming the company will continue keeping a low profile.
What Does Futaba's P/S Mean For Investors?
Its shares have lifted substantially and now Futaba's P/S is back within range of the industry median. It's argued the price-to-sales ratio is an inferior measure of value within certain industries, but it can be a powerful business sentiment indicator.
It appears to us that Futaba maintains its moderate P/S off the back of its recent three-year growth being in line with the wider industry forecast. With previous revenue trends that keep up with the current industry outlook, it's hard to justify the company's P/S ratio deviating much from it's current point. Given the current circumstances, it seems improbable that the share price will experience any significant movement in either direction in the near future if recent medium-term revenue trends persist.
Many other vital risk factors can be found on the company's balance sheet. You can assess many of the main risks through our free balance sheet analysis for Futaba with six simple checks.
If companies with solid past earnings growth is up your alley, you may wish to see this free collection of other companies with strong earnings growth and low P/E ratios.
New: AI Stock Screener & Alerts
Our new AI Stock Screener scans the market every day to uncover opportunities.
• Dividend Powerhouses (3%+ Yield)
• Undervalued Small Caps with Insider Buying
• High growth Tech and AI Companies
Or build your own from over 50 metrics.
Have feedback on this article? Concerned about the content? Get in touch with us directly. Alternatively, email editorial-team (at) simplywallst.com.
This article by Simply Wall St is general in nature. We provide commentary based on historical data and analyst forecasts only using an unbiased methodology and our articles are not intended to be financial advice. It does not constitute a recommendation to buy or sell any stock, and does not take account of your objectives, or your financial situation. We aim to bring you long-term focused analysis driven by fundamental data. Note that our analysis may not factor in the latest price-sensitive company announcements or qualitative material. Simply Wall St has no position in any stocks mentioned.
Have feedback on this article? Concerned about the content? Get in touch with us directly. Alternatively, email editorial-team@simplywallst.com
About TSE:6986
Futaba
Designs, develops, manufactures, and sells electronic equipment, radio control, and manufacturing equipment in Japan and internationally.
Excellent balance sheet and good value.
Similar Companies
Market Insights

Community Narratives


