

Some say volatility, rather than debt, is the best way to think about risk as an investor, but Warren Buffett famously said that 'Volatility is far from synonymous with risk.' When we think about how risky a company is, we always like to look at its use of debt, since debt overload can lead to ruin. We note that Seiwa Electric Mfg. Co., Ltd. (TSE:6748) does have debt on its balance sheet. But should shareholders be worried about its use of debt?
When Is Debt A Problem?
Debt assists a business until the business has trouble paying it off, either with new capital or with free cash flow. In the worst case scenario, a company can go bankrupt if it cannot pay its creditors. While that is not too common, we often do see indebted companies permanently diluting shareholders because lenders force them to raise capital at a distressed price. Of course, the upside of debt is that it often represents cheap capital, especially when it replaces dilution in a company with the ability to reinvest at high rates of return. When we think about a company's use of debt, we first look at cash and debt together.
Check out our latest analysis for Seiwa Electric Mfg
What Is Seiwa Electric Mfg's Debt?
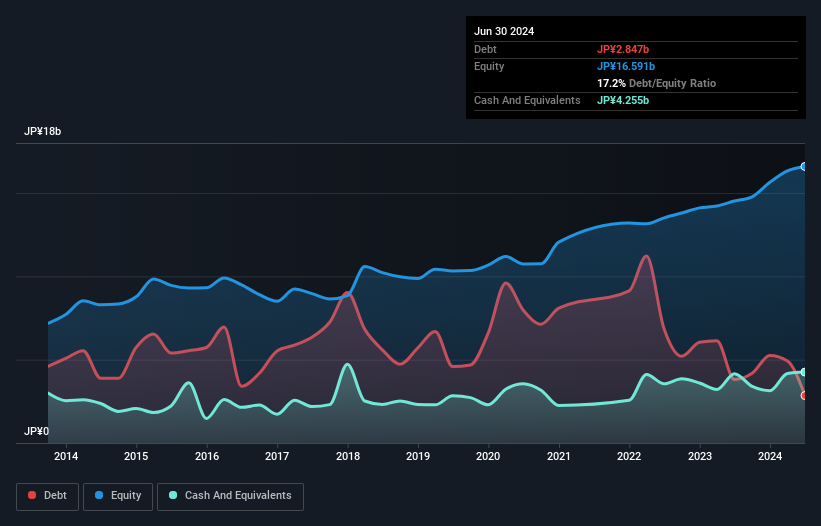
The image below, which you can click on for greater detail, shows that Seiwa Electric Mfg had debt of JP¥2.85b at the end of June 2024, a reduction from JP¥3.81b over a year. However, its balance sheet shows it holds JP¥4.26b in cash, so it actually has JP¥1.41b net cash.
How Strong Is Seiwa Electric Mfg's Balance Sheet?
Zooming in on the latest balance sheet data, we can see that Seiwa Electric Mfg had liabilities of JP¥9.60b due within 12 months and liabilities of JP¥1.71b due beyond that. Offsetting these obligations, it had cash of JP¥4.26b as well as receivables valued at JP¥8.78b due within 12 months. So it actually has JP¥1.73b more liquid assets than total liabilities.
It's good to see that Seiwa Electric Mfg has plenty of liquidity on its balance sheet, suggesting conservative management of liabilities. Given it has easily adequate short term liquidity, we don't think it will have any issues with its lenders. Simply put, the fact that Seiwa Electric Mfg has more cash than debt is arguably a good indication that it can manage its debt safely.
Fortunately, Seiwa Electric Mfg grew its EBIT by 5.3% in the last year, making that debt load look even more manageable. There's no doubt that we learn most about debt from the balance sheet. But you can't view debt in total isolation; since Seiwa Electric Mfg will need earnings to service that debt. So when considering debt, it's definitely worth looking at the earnings trend. Click here for an interactive snapshot.
Finally, a business needs free cash flow to pay off debt; accounting profits just don't cut it. While Seiwa Electric Mfg has net cash on its balance sheet, it's still worth taking a look at its ability to convert earnings before interest and tax (EBIT) to free cash flow, to help us understand how quickly it is building (or eroding) that cash balance. Happily for any shareholders, Seiwa Electric Mfg actually produced more free cash flow than EBIT over the last three years. That sort of strong cash conversion gets us as excited as the crowd when the beat drops at a Daft Punk concert.
Summing Up
While we empathize with investors who find debt concerning, you should keep in mind that Seiwa Electric Mfg has net cash of JP¥1.41b, as well as more liquid assets than liabilities. And it impressed us with free cash flow of JP¥871m, being 113% of its EBIT. So we don't think Seiwa Electric Mfg's use of debt is risky. When analysing debt levels, the balance sheet is the obvious place to start. But ultimately, every company can contain risks that exist outside of the balance sheet. For instance, we've identified 1 warning sign for Seiwa Electric Mfg that you should be aware of.
At the end of the day, it's often better to focus on companies that are free from net debt. You can access our special list of such companies (all with a track record of profit growth). It's free.
New: Manage All Your Stock Portfolios in One Place
We've created the ultimate portfolio companion for stock investors, and it's free.
• Connect an unlimited number of Portfolios and see your total in one currency
• Be alerted to new Warning Signs or Risks via email or mobile
• Track the Fair Value of your stocks
Have feedback on this article? Concerned about the content? Get in touch with us directly. Alternatively, email editorial-team (at) simplywallst.com.
This article by Simply Wall St is general in nature. We provide commentary based on historical data and analyst forecasts only using an unbiased methodology and our articles are not intended to be financial advice. It does not constitute a recommendation to buy or sell any stock, and does not take account of your objectives, or your financial situation. We aim to bring you long-term focused analysis driven by fundamental data. Note that our analysis may not factor in the latest price-sensitive company announcements or qualitative material. Simply Wall St has no position in any stocks mentioned.
About TSE:6748
Seiwa Electric Mfg
Provides information display systems, industrial lighting equipment, road and tunnel lighting equipment, EMC products, LED module products for lighting, and wire protection devices in Japan.
Solid track record with excellent balance sheet and pays a dividend.

