- Japan
- /
- Electrical
- /
- TSE:6507
Sinfonia TechnologyLtd (TSE:6507) jumps 4.9% this week, though earnings growth is still tracking behind three-year shareholder returns

Investing can be hard but the potential fo an individual stock to pay off big time inspires us. But when you hold the right stock for the right time period, the rewards can be truly huge. One bright shining star stock has been Sinfonia Technology Co.,Ltd. (TSE:6507), which is 457% higher than three years ago. It's also good to see the share price up 39% over the last quarter.
Since it's been a strong week for Sinfonia TechnologyLtd shareholders, let's have a look at trend of the longer term fundamentals.
See our latest analysis for Sinfonia TechnologyLtd
While the efficient markets hypothesis continues to be taught by some, it has been proven that markets are over-reactive dynamic systems, and investors are not always rational. One flawed but reasonable way to assess how sentiment around a company has changed is to compare the earnings per share (EPS) with the share price.
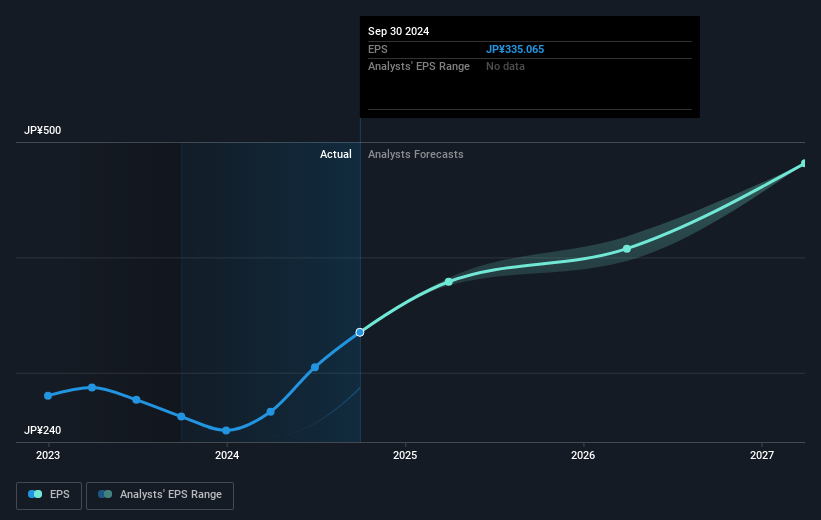
Sinfonia TechnologyLtd was able to grow its EPS at 41% per year over three years, sending the share price higher. In comparison, the 77% per year gain in the share price outpaces the EPS growth. So it's fair to assume the market has a higher opinion of the business than it did three years ago. It is quite common to see investors become enamoured with a business, after a few years of solid progress.
The company's earnings per share (over time) is depicted in the image below (click to see the exact numbers).
It is of course excellent to see how Sinfonia TechnologyLtd has grown profits over the years, but the future is more important for shareholders. This free interactive report on Sinfonia TechnologyLtd's balance sheet strength is a great place to start, if you want to investigate the stock further.
What About Dividends?
When looking at investment returns, it is important to consider the difference between total shareholder return (TSR) and share price return. The TSR is a return calculation that accounts for the value of cash dividends (assuming that any dividend received was reinvested) and the calculated value of any discounted capital raisings and spin-offs. Arguably, the TSR gives a more comprehensive picture of the return generated by a stock. In the case of Sinfonia TechnologyLtd, it has a TSR of 521% for the last 3 years. That exceeds its share price return that we previously mentioned. The dividends paid by the company have thusly boosted the total shareholder return.
A Different Perspective
It's nice to see that Sinfonia TechnologyLtd shareholders have received a total shareholder return of 208% over the last year. And that does include the dividend. Since the one-year TSR is better than the five-year TSR (the latter coming in at 46% per year), it would seem that the stock's performance has improved in recent times. In the best case scenario, this may hint at some real business momentum, implying that now could be a great time to delve deeper. It's always interesting to track share price performance over the longer term. But to understand Sinfonia TechnologyLtd better, we need to consider many other factors. Consider risks, for instance. Every company has them, and we've spotted 1 warning sign for Sinfonia TechnologyLtd you should know about.
Of course Sinfonia TechnologyLtd may not be the best stock to buy. So you may wish to see this free collection of growth stocks.
Please note, the market returns quoted in this article reflect the market weighted average returns of stocks that currently trade on Japanese exchanges.
New: Manage All Your Stock Portfolios in One Place
We've created the ultimate portfolio companion for stock investors, and it's free.
• Connect an unlimited number of Portfolios and see your total in one currency
• Be alerted to new Warning Signs or Risks via email or mobile
• Track the Fair Value of your stocks
Have feedback on this article? Concerned about the content? Get in touch with us directly. Alternatively, email editorial-team (at) simplywallst.com.
This article by Simply Wall St is general in nature. We provide commentary based on historical data and analyst forecasts only using an unbiased methodology and our articles are not intended to be financial advice. It does not constitute a recommendation to buy or sell any stock, and does not take account of your objectives, or your financial situation. We aim to bring you long-term focused analysis driven by fundamental data. Note that our analysis may not factor in the latest price-sensitive company announcements or qualitative material. Simply Wall St has no position in any stocks mentioned.
About TSE:6507
Flawless balance sheet with solid track record.
Similar Companies
Market Insights

Community Narratives
