

Howard Marks put it nicely when he said that, rather than worrying about share price volatility, 'The possibility of permanent loss is the risk I worry about... and every practical investor I know worries about.' When we think about how risky a company is, we always like to look at its use of debt, since debt overload can lead to ruin. We can see that Maezawa Industries, Inc. (TSE:6489) does use debt in its business. But should shareholders be worried about its use of debt?
When Is Debt A Problem?
Debt and other liabilities become risky for a business when it cannot easily fulfill those obligations, either with free cash flow or by raising capital at an attractive price. In the worst case scenario, a company can go bankrupt if it cannot pay its creditors. However, a more common (but still painful) scenario is that it has to raise new equity capital at a low price, thus permanently diluting shareholders. Of course, debt can be an important tool in businesses, particularly capital heavy businesses. The first step when considering a company's debt levels is to consider its cash and debt together.
See our latest analysis for Maezawa Industries
How Much Debt Does Maezawa Industries Carry?
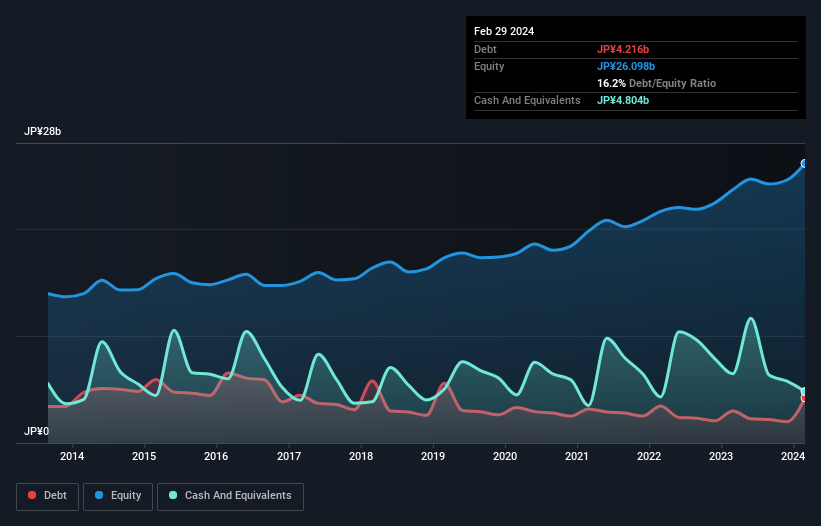
You can click the graphic below for the historical numbers, but it shows that as of February 2024 Maezawa Industries had JP¥4.22b of debt, an increase on JP¥3.00b, over one year. However, it does have JP¥4.80b in cash offsetting this, leading to net cash of JP¥588.0m.
How Strong Is Maezawa Industries' Balance Sheet?
Zooming in on the latest balance sheet data, we can see that Maezawa Industries had liabilities of JP¥11.2b due within 12 months and liabilities of JP¥2.25b due beyond that. On the other hand, it had cash of JP¥4.80b and JP¥14.9b worth of receivables due within a year. So it actually has JP¥6.25b more liquid assets than total liabilities.
It's good to see that Maezawa Industries has plenty of liquidity on its balance sheet, suggesting conservative management of liabilities. Due to its strong net asset position, it is not likely to face issues with its lenders. Simply put, the fact that Maezawa Industries has more cash than debt is arguably a good indication that it can manage its debt safely.
In addition to that, we're happy to report that Maezawa Industries has boosted its EBIT by 44%, thus reducing the spectre of future debt repayments. The balance sheet is clearly the area to focus on when you are analysing debt. But it is Maezawa Industries's earnings that will influence how the balance sheet holds up in the future. So when considering debt, it's definitely worth looking at the earnings trend. Click here for an interactive snapshot.
Finally, while the tax-man may adore accounting profits, lenders only accept cold hard cash. Maezawa Industries may have net cash on the balance sheet, but it is still interesting to look at how well the business converts its earnings before interest and tax (EBIT) to free cash flow, because that will influence both its need for, and its capacity to manage debt. In the last three years, Maezawa Industries's free cash flow amounted to 27% of its EBIT, less than we'd expect. That weak cash conversion makes it more difficult to handle indebtedness.
Summing Up
While it is always sensible to investigate a company's debt, in this case Maezawa Industries has JP¥588.0m in net cash and a decent-looking balance sheet. And it impressed us with its EBIT growth of 44% over the last year. So we don't think Maezawa Industries's use of debt is risky. When analysing debt levels, the balance sheet is the obvious place to start. But ultimately, every company can contain risks that exist outside of the balance sheet. For example - Maezawa Industries has 2 warning signs we think you should be aware of.
When all is said and done, sometimes its easier to focus on companies that don't even need debt. Readers can access a list of growth stocks with zero net debt 100% free, right now.
New: Manage All Your Stock Portfolios in One Place
We've created the ultimate portfolio companion for stock investors, and it's free.
• Connect an unlimited number of Portfolios and see your total in one currency
• Be alerted to new Warning Signs or Risks via email or mobile
• Track the Fair Value of your stocks
Have feedback on this article? Concerned about the content? Get in touch with us directly. Alternatively, email editorial-team (at) simplywallst.com.
This article by Simply Wall St is general in nature. We provide commentary based on historical data and analyst forecasts only using an unbiased methodology and our articles are not intended to be financial advice. It does not constitute a recommendation to buy or sell any stock, and does not take account of your objectives, or your financial situation. We aim to bring you long-term focused analysis driven by fundamental data. Note that our analysis may not factor in the latest price-sensitive company announcements or qualitative material. Simply Wall St has no position in any stocks mentioned.
Have feedback on this article? Concerned about the content? Get in touch with us directly. Alternatively, email editorial-team@simplywallst.com
About TSE:6489
Maezawa Industries
Designs, manufactures, sells, and installs equipment and apparatus for water supply and sewage systems in Japan and internationally.
Undervalued with solid track record and pays a dividend.
Market Insights

Community Narratives

