
Advertisement
Glory Ltd.'s (TSE:6457) Shareholders Might Be Looking For Exit
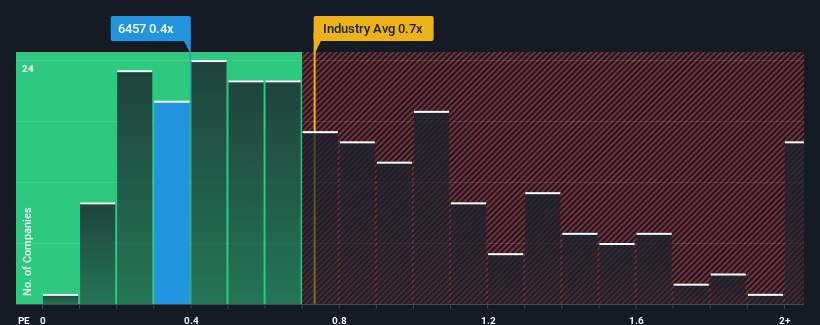
There wouldn't be many who think Glory Ltd.'s (TSE:6457) price-to-sales (or "P/S") ratio of 0.4x is worth a mention when the median P/S for the Machinery industry in Japan is similar at about 0.7x. While this might not raise any eyebrows, if the P/S ratio is not justified investors could be missing out on a potential opportunity or ignoring looming disappointment.
View our latest analysis for Glory
What Does Glory's P/S Mean For Shareholders?
With revenue growth that's superior to most other companies of late, Glory has been doing relatively well. It might be that many expect the strong revenue performance to wane, which has kept the P/S ratio from rising. If you like the company, you'd be hoping this isn't the case so that you could potentially pick up some stock while it's not quite in favour.
If you'd like to see what analysts are forecasting going forward, you should check out our free report on Glory.Do Revenue Forecasts Match The P/S Ratio?
In order to justify its P/S ratio, Glory would need to produce growth that's similar to the industry.
If we review the last year of revenue growth, the company posted a terrific increase of 46%. Pleasingly, revenue has also lifted 71% in aggregate from three years ago, thanks to the last 12 months of growth. So we can start by confirming that the company has done a great job of growing revenue over that time.
Shifting to the future, estimates from the four analysts covering the company suggest revenue growth is heading into negative territory, declining 1.4% per annum over the next three years. That's not great when the rest of the industry is expected to grow by 5.5% per annum.
With this in consideration, we think it doesn't make sense that Glory's P/S is closely matching its industry peers. It seems most investors are hoping for a turnaround in the company's business prospects, but the analyst cohort is not so confident this will happen. There's a good chance these shareholders are setting themselves up for future disappointment if the P/S falls to levels more in line with the negative growth outlook.
What We Can Learn From Glory's P/S?
It's argued the price-to-sales ratio is an inferior measure of value within certain industries, but it can be a powerful business sentiment indicator.
It appears that Glory currently trades on a higher than expected P/S for a company whose revenues are forecast to decline. When we see a gloomy outlook like this, our immediate thoughts are that the share price is at risk of declining, negatively impacting P/S. If the poor revenue outlook tells us one thing, it's that these current price levels could be unsustainable.
There are also other vital risk factors to consider and we've discovered 2 warning signs for Glory (1 doesn't sit too well with us!) that you should be aware of before investing here.
If companies with solid past earnings growth is up your alley, you may wish to see this free collection of other companies with strong earnings growth and low P/E ratios.
New: Manage All Your Stock Portfolios in One Place
We've created the ultimate portfolio companion for stock investors, and it's free.
• Connect an unlimited number of Portfolios and see your total in one currency
• Be alerted to new Warning Signs or Risks via email or mobile
• Track the Fair Value of your stocks
Have feedback on this article? Concerned about the content? Get in touch with us directly. Alternatively, email editorial-team (at) simplywallst.com.
This article by Simply Wall St is general in nature. We provide commentary based on historical data and analyst forecasts only using an unbiased methodology and our articles are not intended to be financial advice. It does not constitute a recommendation to buy or sell any stock, and does not take account of your objectives, or your financial situation. We aim to bring you long-term focused analysis driven by fundamental data. Note that our analysis may not factor in the latest price-sensitive company announcements or qualitative material. Simply Wall St has no position in any stocks mentioned.
Have feedback on this article? Concerned about the content? Get in touch with us directly. Alternatively, email editorial-team@simplywallst.com
About TSE:6457
Glory
Develops, manufactures and sells cash handling machines in Japan, the United States, Europe, and Asia.
Excellent balance sheet average dividend payer.
Market Insights

Advertisement
Community Narratives
Finding The True Value Of A Logistics Powerhouse
Fair Value US$95.21|8.7% undervalued
NV
Community Contributor
Paradigm Biopharmaceuticals Will Lead Osteoarthritis Treatment with Zilosul's FDA Success
Fair Value AU$5.50|93.3% undervalued
AM
Community Contributor
Barrick Mining (ABX:CA): A Gold Hedge against a U.S. Shutdown
Fair Value CA$60.00|18.7% undervalued
GM
Community Contributor