
Advertisement
Takeuchi Mfg (TSE:6432) sheds 3.7% this week, as yearly returns fall more in line with earnings growth

While Takeuchi Mfg. Co., Ltd. (TSE:6432) shareholders are probably generally happy, the stock hasn't had particularly good run recently, with the share price falling 16% in the last quarter. But that doesn't change the fact that shareholders have received really good returns over the last five years. In fact, the share price is 208% higher today. We think it's more important to dwell on the long term returns than the short term returns. Ultimately business performance will determine whether the stock price continues the positive long term trend.
Although Takeuchi Mfg has shed JP¥9.1b from its market cap this week, let's take a look at its longer term fundamental trends and see if they've driven returns.
Check out our latest analysis for Takeuchi Mfg
To quote Buffett, 'Ships will sail around the world but the Flat Earth Society will flourish. There will continue to be wide discrepancies between price and value in the marketplace...' One imperfect but simple way to consider how the market perception of a company has shifted is to compare the change in the earnings per share (EPS) with the share price movement.
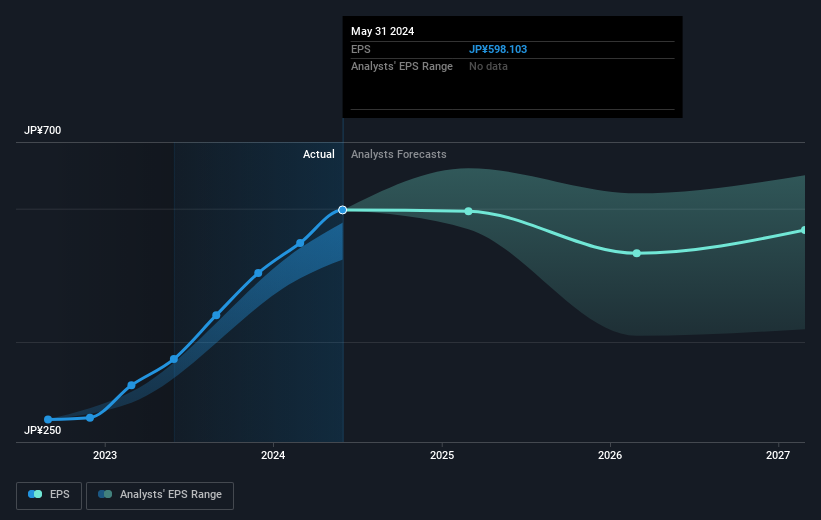
During five years of share price growth, Takeuchi Mfg achieved compound earnings per share (EPS) growth of 22% per year. This EPS growth is reasonably close to the 25% average annual increase in the share price. This indicates that investor sentiment towards the company has not changed a great deal. In fact, the share price seems to largely reflect the EPS growth.
You can see below how EPS has changed over time (discover the exact values by clicking on the image).
It is of course excellent to see how Takeuchi Mfg has grown profits over the years, but the future is more important for shareholders. You can see how its balance sheet has strengthened (or weakened) over time in this free interactive graphic.
What About Dividends?
It is important to consider the total shareholder return, as well as the share price return, for any given stock. The TSR incorporates the value of any spin-offs or discounted capital raisings, along with any dividends, based on the assumption that the dividends are reinvested. So for companies that pay a generous dividend, the TSR is often a lot higher than the share price return. In the case of Takeuchi Mfg, it has a TSR of 253% for the last 5 years. That exceeds its share price return that we previously mentioned. And there's no prize for guessing that the dividend payments largely explain the divergence!
A Different Perspective
Takeuchi Mfg shareholders are up 9.6% for the year (even including dividends). But that was short of the market average. It's probably a good sign that the company has an even better long term track record, having provided shareholders with an annual TSR of 29% over five years. It may well be that this is a business worth popping on the watching, given the continuing positive reception, over time, from the market. Keeping this in mind, a solid next step might be to take a look at Takeuchi Mfg's dividend track record. This free interactive graph is a great place to start.
But note: Takeuchi Mfg may not be the best stock to buy. So take a peek at this free list of interesting companies with past earnings growth (and further growth forecast).
Please note, the market returns quoted in this article reflect the market weighted average returns of stocks that currently trade on Japanese exchanges.
Valuation is complex, but we're here to simplify it.
Discover if Takeuchi Mfg might be undervalued or overvalued with our detailed analysis, featuring fair value estimates, potential risks, dividends, insider trades, and its financial condition.
Access Free AnalysisHave feedback on this article? Concerned about the content? Get in touch with us directly. Alternatively, email editorial-team (at) simplywallst.com.
This article by Simply Wall St is general in nature. We provide commentary based on historical data and analyst forecasts only using an unbiased methodology and our articles are not intended to be financial advice. It does not constitute a recommendation to buy or sell any stock, and does not take account of your objectives, or your financial situation. We aim to bring you long-term focused analysis driven by fundamental data. Note that our analysis may not factor in the latest price-sensitive company announcements or qualitative material. Simply Wall St has no position in any stocks mentioned.
Have feedback on this article? Concerned about the content? Get in touch with us directly. Alternatively, email editorial-team@simplywallst.com
About TSE:6432
Takeuchi Mfg
Manufactures and sells construction machinery in Japan and internationally.
Flawless balance sheet, undervalued and pays a dividend.
Similar Companies
Market Insights


Advertisement
Community Narratives
The Future of Drug Testing? Fingerprint Tech Shows Serious Promise
Fair Value US$2.98|43.0% undervalued
JO
Community Contributor
Suncorp’s Next Chapter: Insurance-Only and Ready to Grow
Fair Value AU$22.83|7.6% undervalued
RO
Community Contributor
Thyssenkrupp Nucera Will Achieve Double-Digit Profits by 2030 Boosted by Hydrogen Growth
Fair Value €14.40|30.6% undervalued
CH
Community Contributor
Tesla’s Nvidia Moment – The AI & Robotics Inflection Point
Fair Value US$359.72|18.3% undervalued
BL
Community Contributor