

Some say volatility, rather than debt, is the best way to think about risk as an investor, but Warren Buffett famously said that 'Volatility is far from synonymous with risk.' So it might be obvious that you need to consider debt, when you think about how risky any given stock is, because too much debt can sink a company. We can see that Daifuku Co., Ltd. (TSE:6383) does use debt in its business. But the more important question is: how much risk is that debt creating?
When Is Debt Dangerous?
Debt and other liabilities become risky for a business when it cannot easily fulfill those obligations, either with free cash flow or by raising capital at an attractive price. Ultimately, if the company can't fulfill its legal obligations to repay debt, shareholders could walk away with nothing. However, a more frequent (but still costly) occurrence is where a company must issue shares at bargain-basement prices, permanently diluting shareholders, just to shore up its balance sheet. Of course, plenty of companies use debt to fund growth, without any negative consequences. When we think about a company's use of debt, we first look at cash and debt together.
View our latest analysis for Daifuku
How Much Debt Does Daifuku Carry?
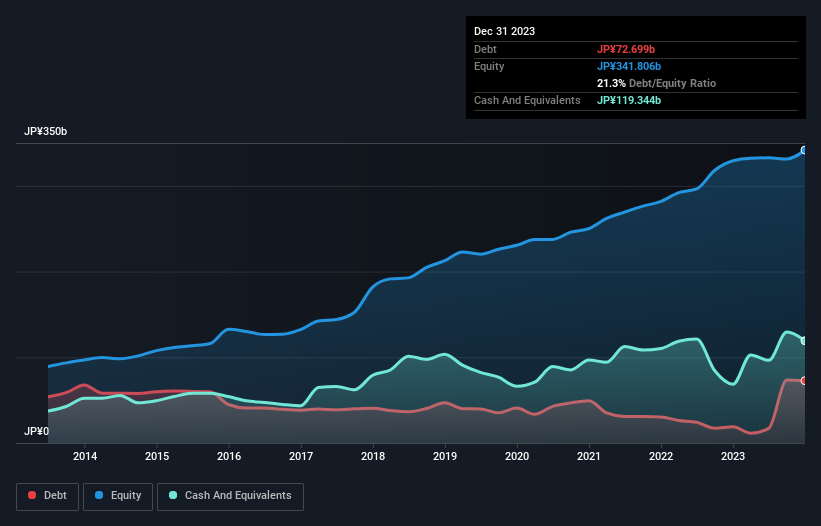
The image below, which you can click on for greater detail, shows that at December 2023 Daifuku had debt of JP¥72.7b, up from JP¥18.9b in one year. However, its balance sheet shows it holds JP¥119.3b in cash, so it actually has JP¥46.6b net cash.
How Strong Is Daifuku's Balance Sheet?
We can see from the most recent balance sheet that Daifuku had liabilities of JP¥221.0b falling due within a year, and liabilities of JP¥77.6b due beyond that. On the other hand, it had cash of JP¥119.3b and JP¥274.3b worth of receivables due within a year. So it can boast JP¥95.1b more liquid assets than total liabilities.
This surplus suggests that Daifuku has a conservative balance sheet, and could probably eliminate its debt without much difficulty. Succinctly put, Daifuku boasts net cash, so it's fair to say it does not have a heavy debt load!
On the other hand, Daifuku saw its EBIT drop by 2.9% in the last twelve months. That sort of decline, if sustained, will obviously make debt harder to handle. The balance sheet is clearly the area to focus on when you are analysing debt. But it is future earnings, more than anything, that will determine Daifuku's ability to maintain a healthy balance sheet going forward. So if you're focused on the future you can check out this free report showing analyst profit forecasts.
Finally, while the tax-man may adore accounting profits, lenders only accept cold hard cash. While Daifuku has net cash on its balance sheet, it's still worth taking a look at its ability to convert earnings before interest and tax (EBIT) to free cash flow, to help us understand how quickly it is building (or eroding) that cash balance. In the last three years, Daifuku's free cash flow amounted to 37% of its EBIT, less than we'd expect. That weak cash conversion makes it more difficult to handle indebtedness.
Summing Up
While it is always sensible to investigate a company's debt, in this case Daifuku has JP¥46.6b in net cash and a decent-looking balance sheet. So we are not troubled with Daifuku's debt use. Above most other metrics, we think its important to track how fast earnings per share is growing, if at all. If you've also come to that realization, you're in luck, because today you can view this interactive graph of Daifuku's earnings per share history for free.
When all is said and done, sometimes its easier to focus on companies that don't even need debt. Readers can access a list of growth stocks with zero net debt 100% free, right now.
New: Manage All Your Stock Portfolios in One Place
We've created the ultimate portfolio companion for stock investors, and it's free.
• Connect an unlimited number of Portfolios and see your total in one currency
• Be alerted to new Warning Signs or Risks via email or mobile
• Track the Fair Value of your stocks
Have feedback on this article? Concerned about the content? Get in touch with us directly. Alternatively, email editorial-team (at) simplywallst.com.
This article by Simply Wall St is general in nature. We provide commentary based on historical data and analyst forecasts only using an unbiased methodology and our articles are not intended to be financial advice. It does not constitute a recommendation to buy or sell any stock, and does not take account of your objectives, or your financial situation. We aim to bring you long-term focused analysis driven by fundamental data. Note that our analysis may not factor in the latest price-sensitive company announcements or qualitative material. Simply Wall St has no position in any stocks mentioned.
About TSE:6383
Daifuku
Provides consulting, engineering, design, manufacture, installation, and after-sales services for logistics systems and material handling equipment in Japan and internationally.
Flawless balance sheet with solid track record.
Market Insights

Community Narratives

