Kimura Chemical Plants Full Year 2025 Earnings: EPS: JP¥117 (vs JP¥78.46 in FY 2024)


Kimura Chemical Plants (TSE:6378) Full Year 2025 Results
Key Financial Results
- Revenue: JP¥26.4b (up 7.1% from FY 2024).
- Net income: JP¥2.31b (up 49% from FY 2024).
- Profit margin: 8.7% (up from 6.3% in FY 2024). The increase in margin was driven by higher revenue.
- EPS: JP¥117 (up from JP¥78.46 in FY 2024).
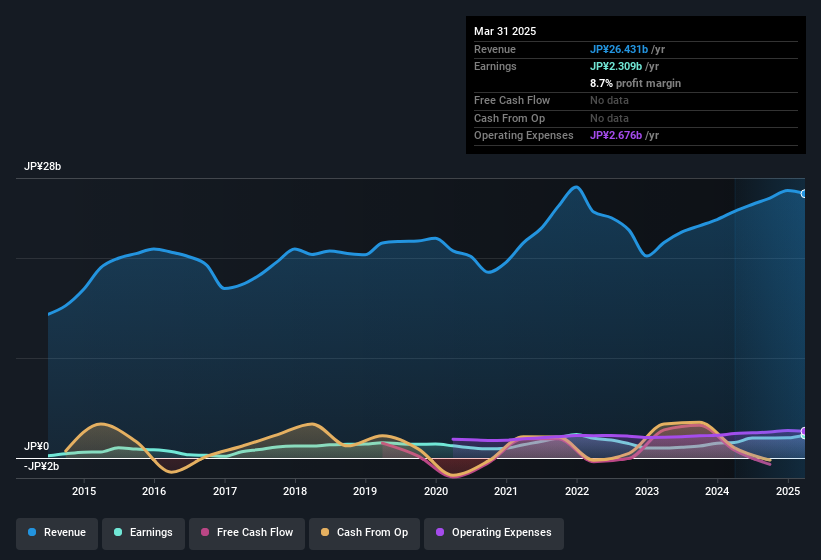
All figures shown in the chart above are for the trailing 12 month (TTM) period
Kimura Chemical Plants shares are up 19% from a week ago.
Risk Analysis
You should always think about risks. Case in point, we've spotted 2 warning signs for Kimura Chemical Plants you should be aware of.
Valuation is complex, but we're here to simplify it.
Discover if Kimura Chemical Plants might be undervalued or overvalued with our detailed analysis, featuring fair value estimates, potential risks, dividends, insider trades, and its financial condition.
Access Free AnalysisHave feedback on this article? Concerned about the content? Get in touch with us directly. Alternatively, email editorial-team (at) simplywallst.com.
This article by Simply Wall St is general in nature. We provide commentary based on historical data and analyst forecasts only using an unbiased methodology and our articles are not intended to be financial advice. It does not constitute a recommendation to buy or sell any stock, and does not take account of your objectives, or your financial situation. We aim to bring you long-term focused analysis driven by fundamental data. Note that our analysis may not factor in the latest price-sensitive company announcements or qualitative material. Simply Wall St has no position in any stocks mentioned.
About TSE:6378
Flawless balance sheet with solid track record and pays a dividend.
Market Insights

Community Narratives


