
Advertisement
While shareholders of Iseki (TSE:6310) are in the black over 1 year, those who bought a week ago aren't so fortunate
It's been a soft week for Iseki & Co., Ltd. (TSE:6310) shares, which are down 15%. On the other hand, over the last twelve months the stock has delivered rather impressive returns. Indeed, the share price is up an impressive 114% in that time. So it is important to view the recent reduction in price through that lense. The real question is whether the business is trending in the right direction.
Although Iseki has shed JP¥8.0b from its market cap this week, let's take a look at its longer term fundamental trends and see if they've driven returns.
There is no denying that markets are sometimes efficient, but prices do not always reflect underlying business performance. One flawed but reasonable way to assess how sentiment around a company has changed is to compare the earnings per share (EPS) with the share price.
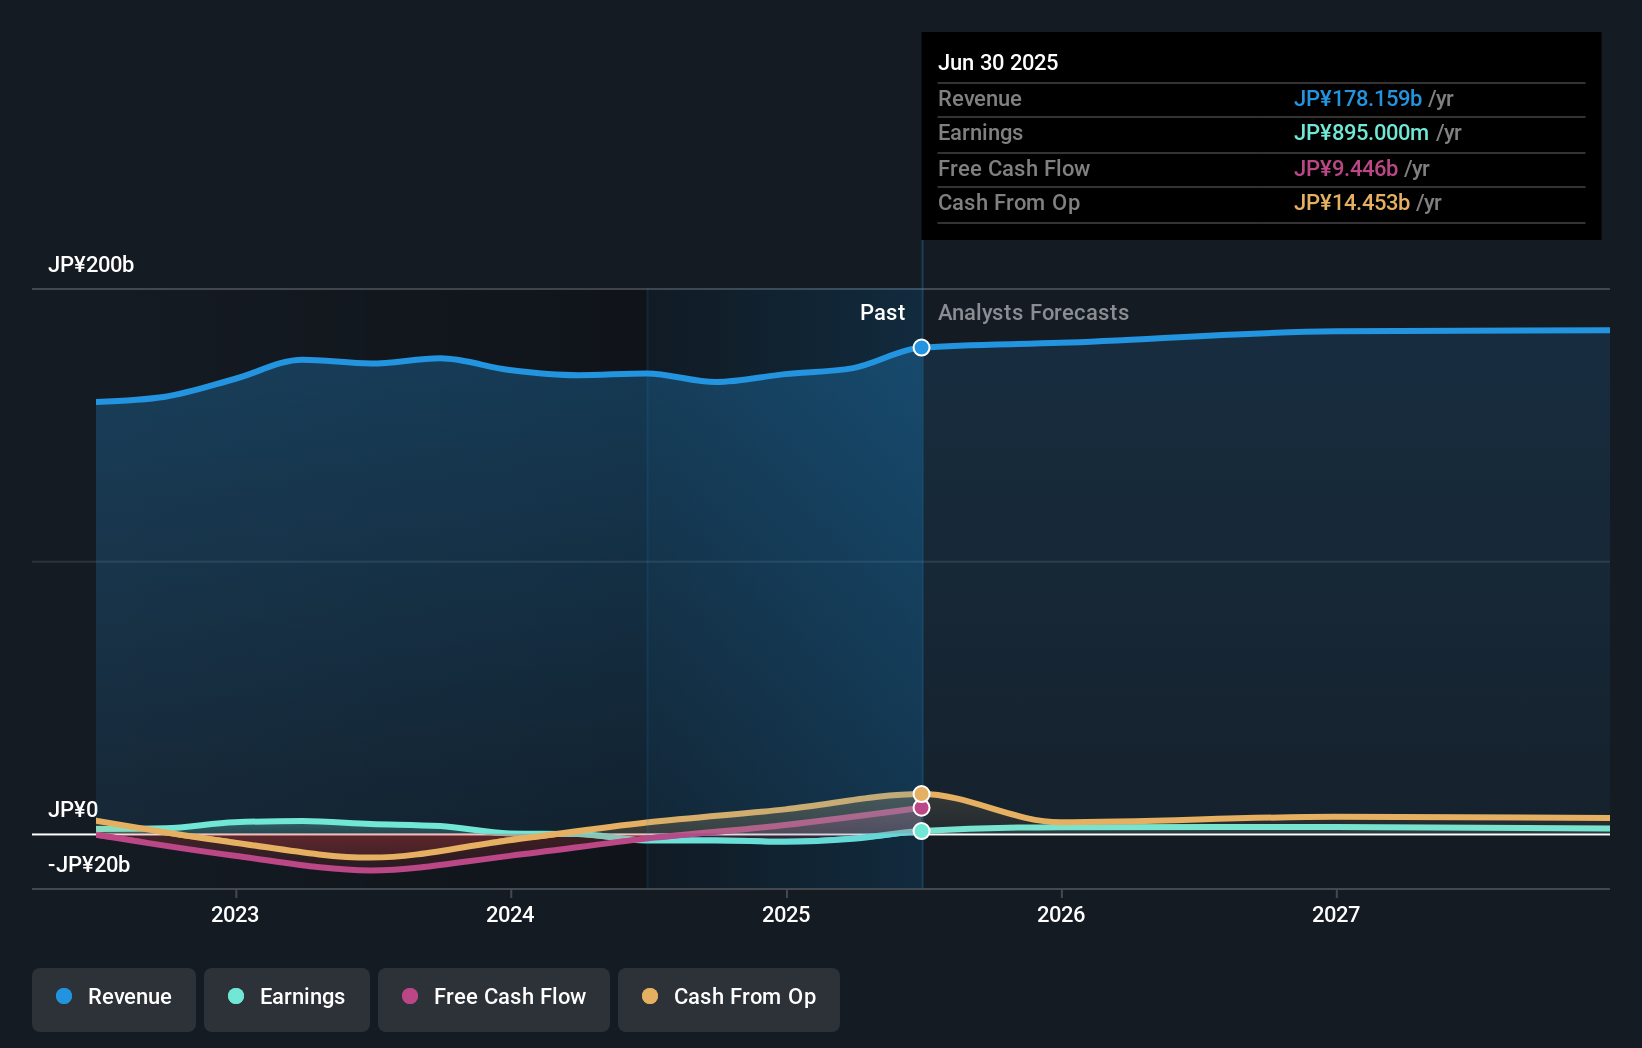
During the last year Iseki grew its earnings per share, moving from a loss to a profit.
When a company has just transitioned to profitability, earnings per share growth is not always the best way to look at the share price action.
We doubt the modest 1.4% dividend yield is doing much to support the share price. However the year on year revenue growth of 5.6% would help. We do see some companies suppress earnings in order to accelerate revenue growth.
You can see how earnings and revenue have changed over time in the image below (click on the chart to see the exact values).
We know that Iseki has improved its bottom line lately, but what does the future have in store? So we recommend checking out this free report showing consensus forecasts
What About Dividends?
As well as measuring the share price return, investors should also consider the total shareholder return (TSR). Whereas the share price return only reflects the change in the share price, the TSR includes the value of dividends (assuming they were reinvested) and the benefit of any discounted capital raising or spin-off. Arguably, the TSR gives a more comprehensive picture of the return generated by a stock. We note that for Iseki the TSR over the last 1 year was 121%, which is better than the share price return mentioned above. And there's no prize for guessing that the dividend payments largely explain the divergence!
A Different Perspective
It's good to see that Iseki has rewarded shareholders with a total shareholder return of 121% in the last twelve months. That's including the dividend. That's better than the annualised return of 11% over half a decade, implying that the company is doing better recently. Given the share price momentum remains strong, it might be worth taking a closer look at the stock, lest you miss an opportunity. I find it very interesting to look at share price over the long term as a proxy for business performance. But to truly gain insight, we need to consider other information, too. For example, we've discovered 2 warning signs for Iseki (1 shouldn't be ignored!) that you should be aware of before investing here.
For those who like to find winning investments this free list of undervalued companies with recent insider purchasing, could be just the ticket.
Please note, the market returns quoted in this article reflect the market weighted average returns of stocks that currently trade on Japanese exchanges.
New: AI Stock Screener & Alerts
Our new AI Stock Screener scans the market every day to uncover opportunities.
• Dividend Powerhouses (3%+ Yield)
• Undervalued Small Caps with Insider Buying
• High growth Tech and AI Companies
Or build your own from over 50 metrics.
Have feedback on this article? Concerned about the content? Get in touch with us directly. Alternatively, email editorial-team (at) simplywallst.com.
This article by Simply Wall St is general in nature. We provide commentary based on historical data and analyst forecasts only using an unbiased methodology and our articles are not intended to be financial advice. It does not constitute a recommendation to buy or sell any stock, and does not take account of your objectives, or your financial situation. We aim to bring you long-term focused analysis driven by fundamental data. Note that our analysis may not factor in the latest price-sensitive company announcements or qualitative material. Simply Wall St has no position in any stocks mentioned.
About TSE:6310
Iseki
Engages in the development, manufacture, and sale of agricultural machinery in Japan, Asia, Europe, North America, and internationally.
Excellent balance sheet with moderate growth potential.
Similar Companies
Market Insights

Advertisement
Community Narratives
The company that turned a verb into a global necessity and basically runs the modern internet, digital ads, smartphones, maps, and AI.
Fair Value US$300.00|8.5% undervalued
OS
Community Contributor
Flowers Foods Pays A Fair Price For Health
Fair Value US$16.12|24.6% undervalued
NV
Community Contributor
TMX Group will thrive with 33.3% profit margin and enduring market moat
Fair Value CA$49.90|0.1% undervalued
LI
Community Contributor