

Howard Marks put it nicely when he said that, rather than worrying about share price volatility, 'The possibility of permanent loss is the risk I worry about... and every practical investor I know worries about.' So it might be obvious that you need to consider debt, when you think about how risky any given stock is, because too much debt can sink a company. We note that SMC Corporation (TSE:6273) does have debt on its balance sheet. But should shareholders be worried about its use of debt?
Why Does Debt Bring Risk?
Debt is a tool to help businesses grow, but if a business is incapable of paying off its lenders, then it exists at their mercy. Part and parcel of capitalism is the process of 'creative destruction' where failed businesses are mercilessly liquidated by their bankers. However, a more common (but still painful) scenario is that it has to raise new equity capital at a low price, thus permanently diluting shareholders. Of course, debt can be an important tool in businesses, particularly capital heavy businesses. When we examine debt levels, we first consider both cash and debt levels, together.
Check out our latest analysis for SMC
How Much Debt Does SMC Carry?
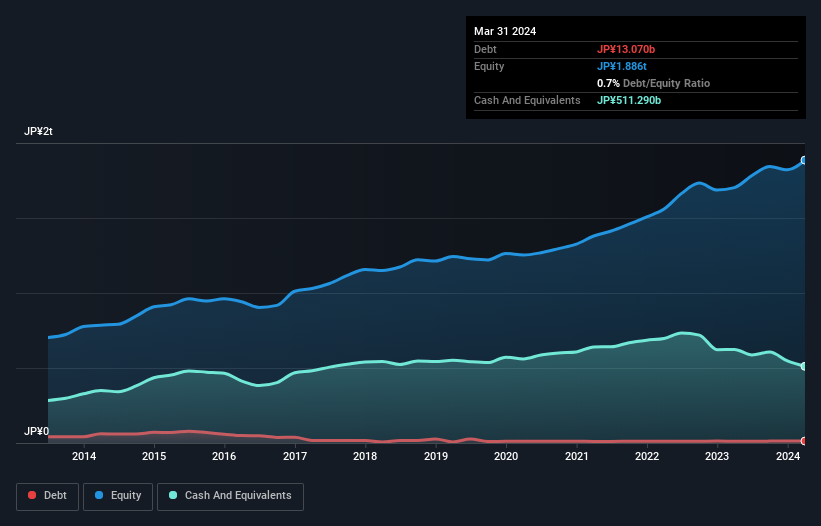
As you can see below, at the end of March 2024, SMC had JP¥13.1b of debt, up from JP¥12.2b a year ago. Click the image for more detail. But on the other hand it also has JP¥511.3b in cash, leading to a JP¥498.2b net cash position.
How Healthy Is SMC's Balance Sheet?
We can see from the most recent balance sheet that SMC had liabilities of JP¥164.6b falling due within a year, and liabilities of JP¥44.1b due beyond that. On the other hand, it had cash of JP¥511.3b and JP¥216.6b worth of receivables due within a year. So it can boast JP¥519.2b more liquid assets than total liabilities.
This surplus suggests that SMC has a conservative balance sheet, and could probably eliminate its debt without much difficulty. Simply put, the fact that SMC has more cash than debt is arguably a good indication that it can manage its debt safely.
The modesty of its debt load may become crucial for SMC if management cannot prevent a repeat of the 24% cut to EBIT over the last year. Falling earnings (if the trend continues) could eventually make even modest debt quite risky. The balance sheet is clearly the area to focus on when you are analysing debt. But it is future earnings, more than anything, that will determine SMC's ability to maintain a healthy balance sheet going forward. So if you want to see what the professionals think, you might find this free report on analyst profit forecasts to be interesting.
Finally, a company can only pay off debt with cold hard cash, not accounting profits. While SMC has net cash on its balance sheet, it's still worth taking a look at its ability to convert earnings before interest and tax (EBIT) to free cash flow, to help us understand how quickly it is building (or eroding) that cash balance. Over the last three years, SMC reported free cash flow worth 14% of its EBIT, which is really quite low. For us, cash conversion that low sparks a little paranoia about is ability to extinguish debt.
Summing Up
While it is always sensible to investigate a company's debt, in this case SMC has JP¥498.2b in net cash and a decent-looking balance sheet. So we are not troubled with SMC's debt use. Above most other metrics, we think its important to track how fast earnings per share is growing, if at all. If you've also come to that realization, you're in luck, because today you can view this interactive graph of SMC's earnings per share history for free.
Of course, if you're the type of investor who prefers buying stocks without the burden of debt, then don't hesitate to discover our exclusive list of net cash growth stocks, today.
If you're looking to trade SMC, open an account with the lowest-cost platform trusted by professionals, Interactive Brokers.
With clients in over 200 countries and territories, and access to 160 markets, IBKR lets you trade stocks, options, futures, forex, bonds and funds from a single integrated account.
Enjoy no hidden fees, no account minimums, and FX conversion rates as low as 0.03%, far better than what most brokers offer.
Sponsored ContentNew: Manage All Your Stock Portfolios in One Place
We've created the ultimate portfolio companion for stock investors, and it's free.
• Connect an unlimited number of Portfolios and see your total in one currency
• Be alerted to new Warning Signs or Risks via email or mobile
• Track the Fair Value of your stocks
Have feedback on this article? Concerned about the content? Get in touch with us directly. Alternatively, email editorial-team (at) simplywallst.com.
This article by Simply Wall St is general in nature. We provide commentary based on historical data and analyst forecasts only using an unbiased methodology and our articles are not intended to be financial advice. It does not constitute a recommendation to buy or sell any stock, and does not take account of your objectives, or your financial situation. We aim to bring you long-term focused analysis driven by fundamental data. Note that our analysis may not factor in the latest price-sensitive company announcements or qualitative material. Simply Wall St has no position in any stocks mentioned.
About TSE:6273
SMC
Manufactures, processes, and sells automatic control equipment, sintered filters, and various types of filtration equipment worldwide.
Flawless balance sheet second-rate dividend payer.
Similar Companies
Market Insights

Community Narratives

