The Return Trends At Sankyo TateyamaInc (TSE:5932) Look Promising


What are the early trends we should look for to identify a stock that could multiply in value over the long term? Amongst other things, we'll want to see two things; firstly, a growing return on capital employed (ROCE) and secondly, an expansion in the company's amount of capital employed. This shows us that it's a compounding machine, able to continually reinvest its earnings back into the business and generate higher returns. With that in mind, we've noticed some promising trends at Sankyo TateyamaInc (TSE:5932) so let's look a bit deeper.
Understanding Return On Capital Employed (ROCE)
For those who don't know, ROCE is a measure of a company's yearly pre-tax profit (its return), relative to the capital employed in the business. The formula for this calculation on Sankyo TateyamaInc is:
Return on Capital Employed = Earnings Before Interest and Tax (EBIT) ÷ (Total Assets - Current Liabilities)
0.022 = JP¥3.8b ÷ (JP¥290b - JP¥119b) (Based on the trailing twelve months to May 2024).
So, Sankyo TateyamaInc has an ROCE of 2.2%. Ultimately, that's a low return and it under-performs the Building industry average of 7.5%.
View our latest analysis for Sankyo TateyamaInc
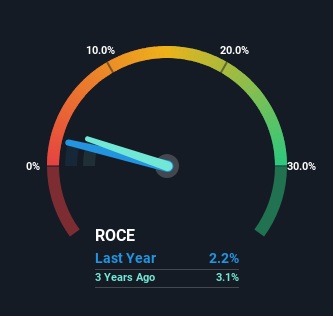
Historical performance is a great place to start when researching a stock so above you can see the gauge for Sankyo TateyamaInc's ROCE against it's prior returns. If you'd like to look at how Sankyo TateyamaInc has performed in the past in other metrics, you can view this free graph of Sankyo TateyamaInc's past earnings, revenue and cash flow.
What Does the ROCE Trend For Sankyo TateyamaInc Tell Us?
While there are companies with higher returns on capital out there, we still find the trend at Sankyo TateyamaInc promising. More specifically, while the company has kept capital employed relatively flat over the last five years, the ROCE has climbed 385% in that same time. So it's likely that the business is now reaping the full benefits of its past investments, since the capital employed hasn't changed considerably. It's worth looking deeper into this though because while it's great that the business is more efficient, it might also mean that going forward the areas to invest internally for the organic growth are lacking.
On a separate but related note, it's important to know that Sankyo TateyamaInc has a current liabilities to total assets ratio of 41%, which we'd consider pretty high. This can bring about some risks because the company is basically operating with a rather large reliance on its suppliers or other sorts of short-term creditors. While it's not necessarily a bad thing, it can be beneficial if this ratio is lower.
The Bottom Line On Sankyo TateyamaInc's ROCE
As discussed above, Sankyo TateyamaInc appears to be getting more proficient at generating returns since capital employed has remained flat but earnings (before interest and tax) are up. And since the stock has fallen 32% over the last five years, there might be an opportunity here. With that in mind, we believe the promising trends warrant this stock for further investigation.
If you'd like to know about the risks facing Sankyo TateyamaInc, we've discovered 2 warning signs that you should be aware of.
While Sankyo TateyamaInc isn't earning the highest return, check out this free list of companies that are earning high returns on equity with solid balance sheets.
New: Manage All Your Stock Portfolios in One Place
We've created the ultimate portfolio companion for stock investors, and it's free.
• Connect an unlimited number of Portfolios and see your total in one currency
• Be alerted to new Warning Signs or Risks via email or mobile
• Track the Fair Value of your stocks
Have feedback on this article? Concerned about the content? Get in touch with us directly. Alternatively, email editorial-team (at) simplywallst.com.
This article by Simply Wall St is general in nature. We provide commentary based on historical data and analyst forecasts only using an unbiased methodology and our articles are not intended to be financial advice. It does not constitute a recommendation to buy or sell any stock, and does not take account of your objectives, or your financial situation. We aim to bring you long-term focused analysis driven by fundamental data. Note that our analysis may not factor in the latest price-sensitive company announcements or qualitative material. Simply Wall St has no position in any stocks mentioned.
About TSE:5932
Sankyo TateyamaInc
Engages in the development, manufacture, and sale of building, housing, and exterior construction materials in Japan.
Good value with adequate balance sheet and pays a dividend.

