Getting In Cheap On Sanwa Holdings Corporation (TSE:5929) Might Be Difficult

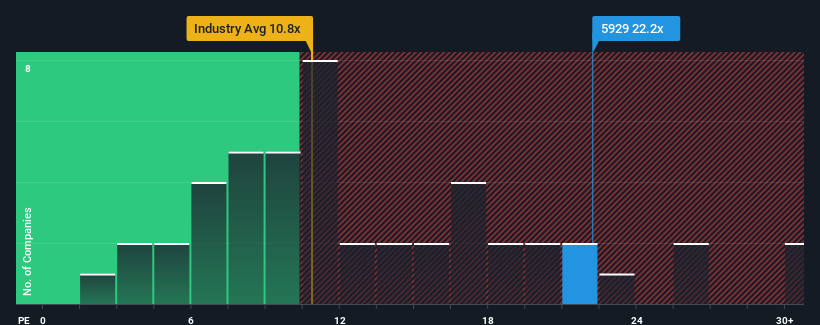
With a price-to-earnings (or "P/E") ratio of 22.2x Sanwa Holdings Corporation (TSE:5929) may be sending very bearish signals at the moment, given that almost half of all companies in Japan have P/E ratios under 13x and even P/E's lower than 9x are not unusual. Nonetheless, we'd need to dig a little deeper to determine if there is a rational basis for the highly elevated P/E.
Recent earnings growth for Sanwa Holdings has been in line with the market. One possibility is that the P/E is high because investors think this modest earnings performance will accelerate. If not, then existing shareholders may be a little nervous about the viability of the share price.
View our latest analysis for Sanwa Holdings

Is There Enough Growth For Sanwa Holdings?
There's an inherent assumption that a company should far outperform the market for P/E ratios like Sanwa Holdings' to be considered reasonable.
If we review the last year of earnings growth, the company posted a worthy increase of 8.6%. The latest three year period has also seen an excellent 86% overall rise in EPS, aided somewhat by its short-term performance. Accordingly, shareholders would have probably welcomed those medium-term rates of earnings growth.
Looking ahead now, EPS is anticipated to climb by 13% each year during the coming three years according to the seven analysts following the company. That's shaping up to be materially higher than the 10% each year growth forecast for the broader market.
In light of this, it's understandable that Sanwa Holdings' P/E sits above the majority of other companies. It seems most investors are expecting this strong future growth and are willing to pay more for the stock.
The Key Takeaway
Using the price-to-earnings ratio alone to determine if you should sell your stock isn't sensible, however it can be a practical guide to the company's future prospects.
As we suspected, our examination of Sanwa Holdings' analyst forecasts revealed that its superior earnings outlook is contributing to its high P/E. Right now shareholders are comfortable with the P/E as they are quite confident future earnings aren't under threat. It's hard to see the share price falling strongly in the near future under these circumstances.
A lot of potential risks can sit within a company's balance sheet. Our free balance sheet analysis for Sanwa Holdings with six simple checks will allow you to discover any risks that could be an issue.
If these risks are making you reconsider your opinion on Sanwa Holdings, explore our interactive list of high quality stocks to get an idea of what else is out there.
New: Manage All Your Stock Portfolios in One Place
We've created the ultimate portfolio companion for stock investors, and it's free.
• Connect an unlimited number of Portfolios and see your total in one currency
• Be alerted to new Warning Signs or Risks via email or mobile
• Track the Fair Value of your stocks
Have feedback on this article? Concerned about the content? Get in touch with us directly. Alternatively, email editorial-team (at) simplywallst.com.
This article by Simply Wall St is general in nature. We provide commentary based on historical data and analyst forecasts only using an unbiased methodology and our articles are not intended to be financial advice. It does not constitute a recommendation to buy or sell any stock, and does not take account of your objectives, or your financial situation. We aim to bring you long-term focused analysis driven by fundamental data. Note that our analysis may not factor in the latest price-sensitive company announcements or qualitative material. Simply Wall St has no position in any stocks mentioned.
About TSE:5929
Sanwa Holdings
Through its subsidiaries, manufactures and sells steel construction materials for commercial and residential construction in Japan, North America, Europe, and Asia.
Flawless balance sheet established dividend payer.
Market Insights
Community Narratives


