Advertisement
- Japan
- /
- Electrical
- /
- TSE:5803
A Look at Fujikura (TSE:5803) Valuation After Takaichi’s AI Investment Pledge and Expansion Moves

Simply Wall St
Reviewed by Simply Wall St
Fujikura (TSE:5803) shares have climbed after Sanae Takaichi was elected prime minister. Her promises of targeted investment in artificial intelligence and key industries have added to investor optimism around the company’s recent expansion moves.
See our latest analysis for Fujikura.
Fujikura’s share price has not only rallied on fresh optimism around AI investment but has shown remarkable momentum all year, with a 1-day share price return of nearly 4% and an eye-catching 171% gain so far in 2024. Long-term investors have seen even bigger rewards, as total shareholder return over the past year soared 258% and over five years topped 7,100%. This reflects market confidence in the company’s strategy and sector tailwinds.
If you’re looking for more ideas in the AI and tech space, this could be an ideal moment to discover See the full list for free.
Yet with shares surging more than 170% this year, investors are now asking whether Fujikura is still undervalued or if the market has already priced in all that future growth potential. The key question is whether there is still a buying opportunity.
Price-to-Earnings of 47.9x: Is it justified?
Fujikura’s last close at ¥17,925 sees investors paying a hefty premium for its near-term earnings, with a price-to-earnings (P/E) ratio of 47.9x. This multiple positions Fujikura as significantly more expensive than both its industry peers and the overall market. This suggests that buyers expect continued outperformance or future growth far in excess of sector averages.
The P/E ratio tells us how much the market is willing to pay now for a company’s earnings. For Fujikura, a 47.9x ratio means investors are valuing each yen of current earnings nearly 48 times over, indicating very high earnings growth is expected or that recent results are considered temporary peaks.
However, Fujikura’s P/E sits sharply above the Japanese Electrical industry average of 13.3x and even pricier than the peer group’s average of 22.5x. Compared to the estimated fair price-to-earnings ratio of 41.6x, Fujikura’s valuation looks stretched unless it can deliver outsized profitability or breakthrough expansion that its peers cannot match. The high multiple raises the bar for future performance and leaves little margin for disappointment.
Explore the SWS fair ratio for Fujikura
Result: Price-to-Earnings of 47.9x (OVERVALUED)
However, ongoing analyst concerns about overvaluation and potential earnings compression could quickly dampen optimism if expected growth does not materialize.
Find out about the key risks to this Fujikura narrative.
Another View: Discounted Cash Flow Says Overvalued
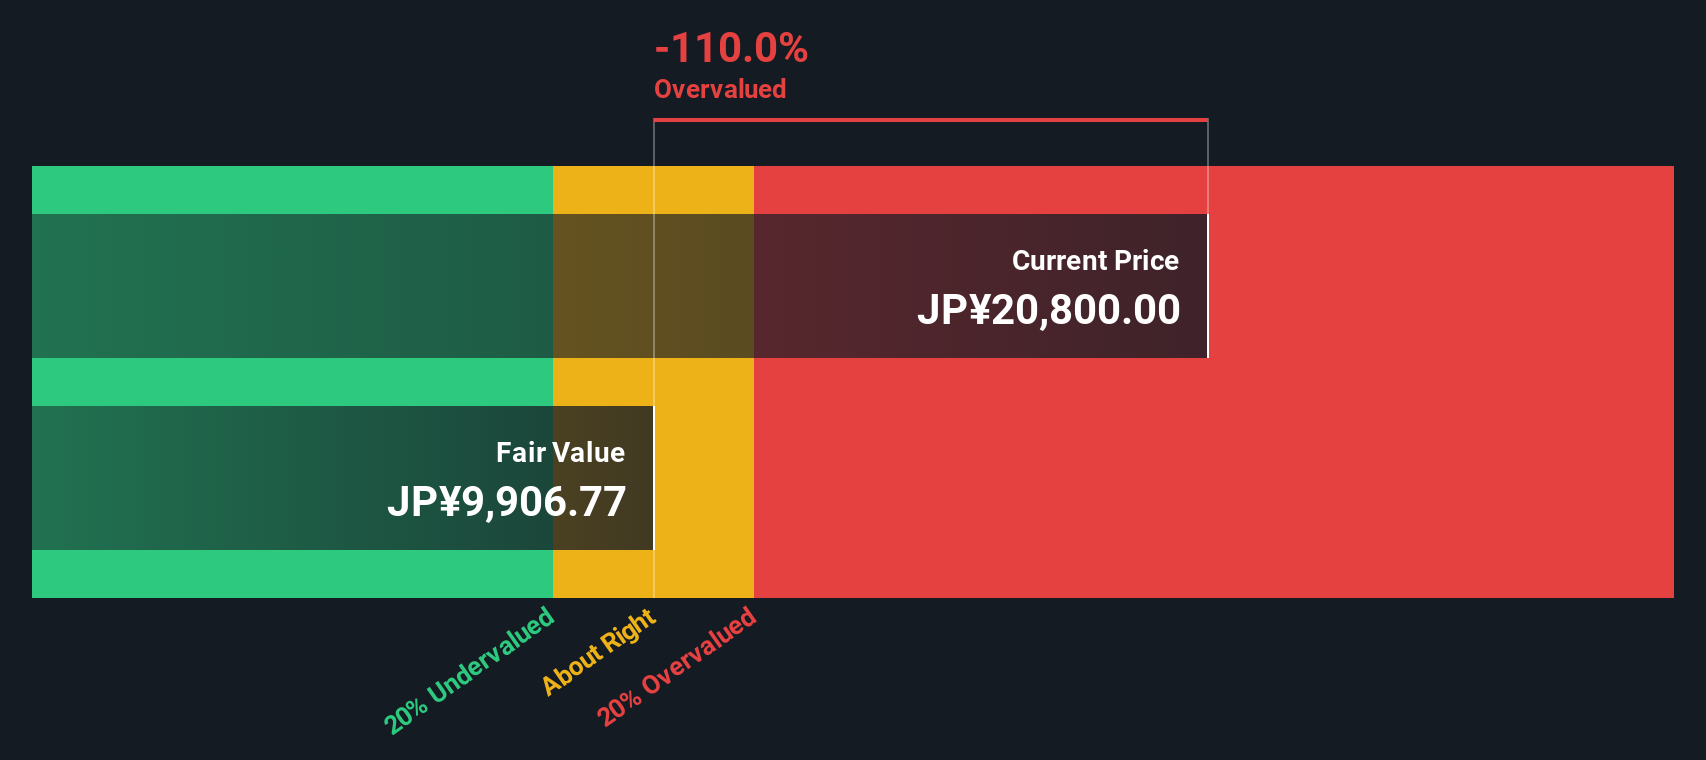
Stepping back from earnings multiples, our SWS DCF model offers a different perspective. Based on this approach, Fujikura’s shares are trading well above the estimated fair value of ¥10,099. With this discount of around 77%, the DCF view suggests the market may have become overly optimistic. This could raise the question of whether the rally has gone too far.
Look into how the SWS DCF model arrives at its fair value.
Simply Wall St performs a discounted cash flow (DCF) on every stock in the world every day (check out Fujikura for example). We show the entire calculation in full. You can track the result in your watchlist or portfolio and be alerted when this changes, or use our stock screener to discover undervalued stocks based on their cash flows. If you save a screener we even alert you when new companies match - so you never miss a potential opportunity.
Build Your Own Fujikura Narrative
If our analysis doesn't align with your outlook or you prefer diving into the numbers on your own, you can build your own view in just a few minutes, Do it your way.
A great starting point for your Fujikura research is our analysis highlighting 2 key rewards and 1 important warning sign that could impact your investment decision.
Looking for more investment ideas?
Take action now to uncover potential winners that might not be on your radar. The best opportunities are often found before the crowd catches on, so don’t miss out.
- Tap into high-yield opportunities by checking out these 17 dividend stocks with yields > 3%, which offers robust payouts and steady income potential.
- Spot hidden gems in cutting-edge healthcare technology with these 33 healthcare AI stocks, designed to surface tomorrow’s clinical innovators.
- Capitalize on the future of finance as you scan these 80 cryptocurrency and blockchain stocks, which powers advancements in digital assets and blockchain infrastructure.
This article by Simply Wall St is general in nature. We provide commentary based on historical data and analyst forecasts only using an unbiased methodology and our articles are not intended to be financial advice. It does not constitute a recommendation to buy or sell any stock, and does not take account of your objectives, or your financial situation. We aim to bring you long-term focused analysis driven by fundamental data. Note that our analysis may not factor in the latest price-sensitive company announcements or qualitative material. Simply Wall St has no position in any stocks mentioned.
New: AI Stock Screener & Alerts
Our new AI Stock Screener scans the market every day to uncover opportunities.
• Dividend Powerhouses (3%+ Yield)
• Undervalued Small Caps with Insider Buying
• High growth Tech and AI Companies
Or build your own from over 50 metrics.
Have feedback on this article? Concerned about the content? Get in touch with us directly. Alternatively, email editorial-team@simplywallst.com
About TSE:5803
Fujikura
Engages in telecommunication and power systems, electronic, and automotive products businesses in Japan, the rest of Asia, North America, Europe, and internationally.
Outstanding track record with flawless balance sheet.
Similar Companies
Market Insights

Advertisement
Community Narratives
The company that turned a verb into a global necessity and basically runs the modern internet, digital ads, smartphones, maps, and AI.
Fair Value US$300.00|10.8% undervalued
OS
Community Contributor
Flowers Foods Pays A Fair Price For Health
Fair Value US$16.12|22.0% undervalued
NV
Community Contributor
TMX Group will thrive with 33.3% profit margin and enduring market moat
Fair Value CA$49.90|3.8% overvalued
LI
Community Contributor