Discovering MEISEI INDUSTRIALLtd And 2 Other Hidden Japanese Small Caps With Strong Potential

Reviewed by Simply Wall St

As Japan’s stock markets experience a downturn, with the Nikkei 225 Index down 5.8% and the broader TOPIX Index registering a 4.2% loss, investors are increasingly looking for opportunities in small-cap stocks that may offer resilience and growth potential amid broader market volatility. In this environment, identifying companies with strong fundamentals and unique market positions can be crucial for uncovering hidden gems.
Top 10 Undiscovered Gems With Strong Fundamentals In Japan
| Name | Debt To Equity | Revenue Growth | Earnings Growth | Health Rating |
|---|---|---|---|---|
| Ryoyu Systems | NA | 1.08% | 8.08% | ★★★★★★ |
| NJS | NA | 4.97% | 5.30% | ★★★★★★ |
| Kanda HoldingsLtd | 30.47% | 4.35% | 18.02% | ★★★★★★ |
| Poppins | 39.80% | 8.36% | -7.40% | ★★★★★★ |
| Ad-Sol Nissin | NA | 4.02% | 7.90% | ★★★★★★ |
| Otec | 9.81% | 2.32% | -1.39% | ★★★★★★ |
| NPR-Riken | 15.31% | 10.00% | 44.55% | ★★★★★☆ |
| Toho | 82.16% | 1.83% | 47.38% | ★★★★★☆ |
| AJIS | 0.69% | 0.07% | -12.44% | ★★★★★☆ |
| Pharma Foods International | 191.14% | 33.83% | 23.46% | ★★★★★☆ |
Below we spotlight a couple of our favorites from our exclusive screener.
MEISEI INDUSTRIALLtd (TSE:1976)
Simply Wall St Value Rating: ★★★★★★
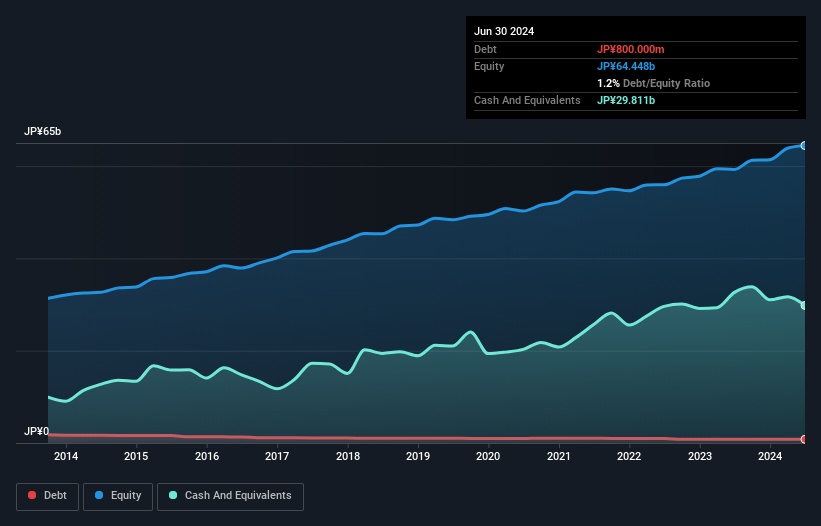
Overview: MEISEI INDUSTRIAL Co., Ltd. operates as a construction works company in Japan and internationally with a market cap of ¥57.43 billion.
Operations: MEISEI INDUSTRIAL Co., Ltd. generates revenue primarily from its Construction Work segment (¥55.55 billion) and Boiler Business (¥7.45 billion).
MEISEI INDUSTRIAL Ltd., a small cap, has shown impressive growth with earnings increasing by 44.4% over the past year, outpacing the Construction industry’s 25.5%. The company's debt to equity ratio improved from 2.1% to 1.2% in five years, reflecting prudent financial management. Trading at 54.4% below estimated fair value suggests potential for significant upside. With high-quality earnings and more cash than total debt, MEISEI seems well-positioned for continued stability and growth in its sector.
KYORIN Pharmaceutical (TSE:4569)
Simply Wall St Value Rating: ★★★★★☆
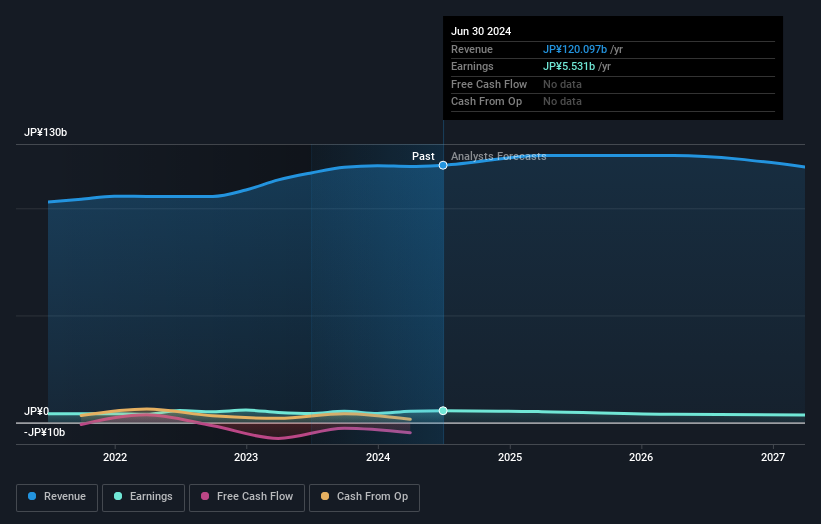
Overview: KYORIN Pharmaceutical Co., Ltd. researches, develops, manufactures, and sells ethical and generic drugs in Japan and internationally with a market cap of ¥88.13 billion.
Operations: KYORIN Pharmaceutical generates revenue primarily from its pharmaceutical business, which reported ¥120.10 billion in revenue. The company's net profit margin stands at 5.23%.
Kyorin Pharmaceutical, a small-cap player in the Japanese market, has shown robust earnings growth of 31.2% over the past year, outpacing the industry average of 8.6%. The company's debt to equity ratio improved from 19.4% to 15.9% over five years, indicating prudent financial management. Trading at a price-to-earnings ratio of 15.9x compared to the industry average of 17.6x suggests it offers good value for investors looking at pharmaceuticals in Japan.
- Delve into the full analysis health report here for a deeper understanding of KYORIN Pharmaceutical.
Mitsuboshi Belting (TSE:5192)
Simply Wall St Value Rating: ★★★★★★
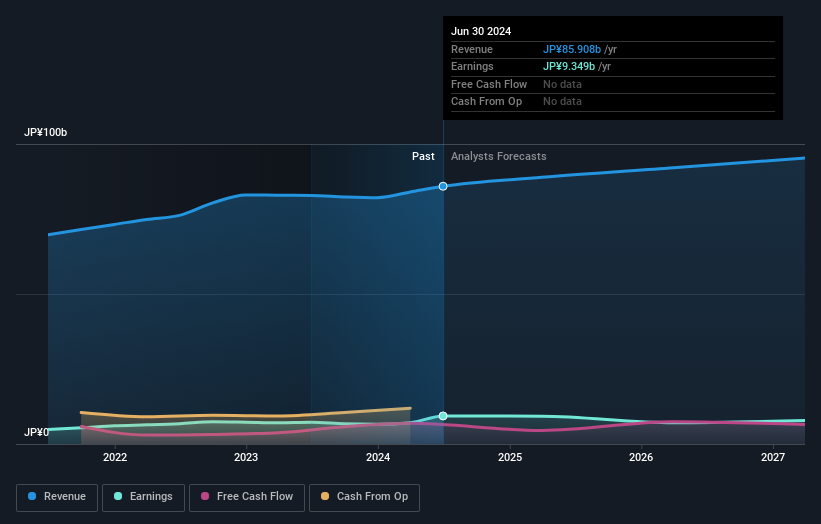
Overview: Mitsuboshi Belting Ltd. manufactures and sells power transmission belts, waterproofing and water shielding sheets, and engineering plastics and structural foams in Japan and internationally, with a market cap of ¥112.91 billion.
Operations: The company generates revenue primarily from the sale of power transmission belts, waterproofing and water shielding sheets, and engineering plastics and structural foams. The cost structure includes manufacturing expenses related to these products. Net profit margin trends are notable for their variability over recent periods.
Mitsuboshi Belting, a smaller player in the machinery sector, has shown impressive earnings growth of 29.5% over the past year, outpacing the industry's 12.9%. With a debt-to-equity ratio reduced from 11.7% to 6.1% over five years and more cash than total debt, financial stability is evident. The company also enjoys a favorable price-to-earnings ratio of 12.1x compared to the JP market's 13.2x, indicating potential value for investors.
- Take a closer look at Mitsuboshi Belting's potential here in our health report.
Gain insights into Mitsuboshi Belting's past trends and performance with our Past report.
Taking Advantage
- Access the full spectrum of 749 Japanese Undiscovered Gems With Strong Fundamentals by clicking on this link.
- Are any of these part of your asset mix? Tap into the analytical power of Simply Wall St's portfolio to get a 360-degree view on how they're shaping up.
- Discover a world of investment opportunities with Simply Wall St's free app and access unparalleled stock analysis across all markets.
Searching for a Fresh Perspective?
- Explore high-performing small cap companies that haven't yet garnered significant analyst attention.
- Fuel your portfolio with companies showing strong growth potential, backed by optimistic outlooks both from analysts and management.
- Find companies with promising cash flow potential yet trading below their fair value.
This article by Simply Wall St is general in nature. We provide commentary based on historical data and analyst forecasts only using an unbiased methodology and our articles are not intended to be financial advice. It does not constitute a recommendation to buy or sell any stock, and does not take account of your objectives, or your financial situation. We aim to bring you long-term focused analysis driven by fundamental data. Note that our analysis may not factor in the latest price-sensitive company announcements or qualitative material. Simply Wall St has no position in any stocks mentioned.
Valuation is complex, but we're here to simplify it.
Discover if KYORIN Pharmaceutical might be undervalued or overvalued with our detailed analysis, featuring fair value estimates, potential risks, dividends, insider trades, and its financial condition.
Access Free AnalysisHave feedback on this article? Concerned about the content? Get in touch with us directly. Alternatively, email editorial-team@simplywallst.com
About TSE:4569
KYORIN Pharmaceutical
Through its subsidiaries, researches and develops, manufactures, and sells ethical and generic drugs in Japan and internationally.
Excellent balance sheet unattractive dividend payer.
