

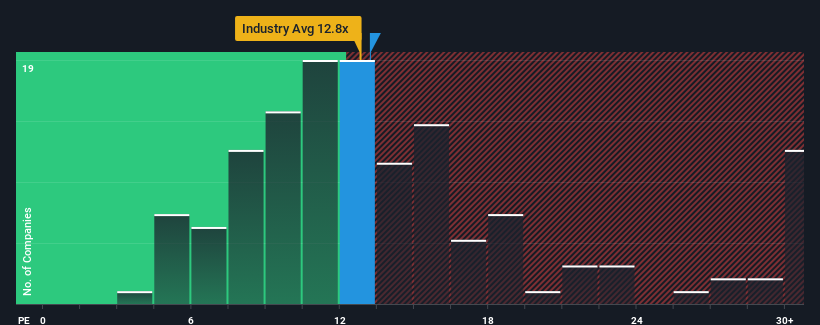
With a median price-to-earnings (or "P/E") ratio of close to 14x in Japan, you could be forgiven for feeling indifferent about Kandenko Co.,Ltd.'s (TSE:1942) P/E ratio of 13.2x. Although, it's not wise to simply ignore the P/E without explanation as investors may be disregarding a distinct opportunity or a costly mistake.
KandenkoLtd certainly has been doing a good job lately as it's been growing earnings more than most other companies. One possibility is that the P/E is moderate because investors think this strong earnings performance might be about to tail off. If you like the company, you'd be hoping this isn't the case so that you could potentially pick up some stock while it's not quite in favour.
View our latest analysis for KandenkoLtd
How Is KandenkoLtd's Growth Trending?
KandenkoLtd's P/E ratio would be typical for a company that's only expected to deliver moderate growth, and importantly, perform in line with the market.
Taking a look back first, we see that the company grew earnings per share by an impressive 25% last year. The latest three year period has also seen a 22% overall rise in EPS, aided extensively by its short-term performance. So we can start by confirming that the company has actually done a good job of growing earnings over that time.
Shifting to the future, estimates from the five analysts covering the company suggest earnings should grow by 2.0% each year over the next three years. With the market predicted to deliver 10% growth each year, the company is positioned for a weaker earnings result.
With this information, we find it interesting that KandenkoLtd is trading at a fairly similar P/E to the market. It seems most investors are ignoring the fairly limited growth expectations and are willing to pay up for exposure to the stock. Maintaining these prices will be difficult to achieve as this level of earnings growth is likely to weigh down the shares eventually.
The Final Word
Generally, our preference is to limit the use of the price-to-earnings ratio to establishing what the market thinks about the overall health of a company.
We've established that KandenkoLtd currently trades on a higher than expected P/E since its forecast growth is lower than the wider market. When we see a weak earnings outlook with slower than market growth, we suspect the share price is at risk of declining, sending the moderate P/E lower. This places shareholders' investments at risk and potential investors in danger of paying an unnecessary premium.
A lot of potential risks can sit within a company's balance sheet. Our free balance sheet analysis for KandenkoLtd with six simple checks will allow you to discover any risks that could be an issue.
You might be able to find a better investment than KandenkoLtd. If you want a selection of possible candidates, check out this free list of interesting companies that trade on a low P/E (but have proven they can grow earnings).
Valuation is complex, but we're here to simplify it.
Discover if KandenkoLtd might be undervalued or overvalued with our detailed analysis, featuring fair value estimates, potential risks, dividends, insider trades, and its financial condition.
Access Free AnalysisHave feedback on this article? Concerned about the content? Get in touch with us directly. Alternatively, email editorial-team (at) simplywallst.com.
This article by Simply Wall St is general in nature. We provide commentary based on historical data and analyst forecasts only using an unbiased methodology and our articles are not intended to be financial advice. It does not constitute a recommendation to buy or sell any stock, and does not take account of your objectives, or your financial situation. We aim to bring you long-term focused analysis driven by fundamental data. Note that our analysis may not factor in the latest price-sensitive company announcements or qualitative material. Simply Wall St has no position in any stocks mentioned.
About TSE:1942
Flawless balance sheet with solid track record and pays a dividend.
Market Insights

Community Narratives

