
Advertisement

Legendary fund manager Li Lu (who Charlie Munger backed) once said, 'The biggest investment risk is not the volatility of prices, but whether you will suffer a permanent loss of capital.' So it might be obvious that you need to consider debt, when you think about how risky any given stock is, because too much debt can sink a company. Importantly, Yurtec Corporation (TSE:1934) does carry debt. But should shareholders be worried about its use of debt?
Why Does Debt Bring Risk?
Debt and other liabilities become risky for a business when it cannot easily fulfill those obligations, either with free cash flow or by raising capital at an attractive price. Ultimately, if the company can't fulfill its legal obligations to repay debt, shareholders could walk away with nothing. However, a more common (but still painful) scenario is that it has to raise new equity capital at a low price, thus permanently diluting shareholders. Of course, plenty of companies use debt to fund growth, without any negative consequences. The first step when considering a company's debt levels is to consider its cash and debt together.
View our latest analysis for Yurtec
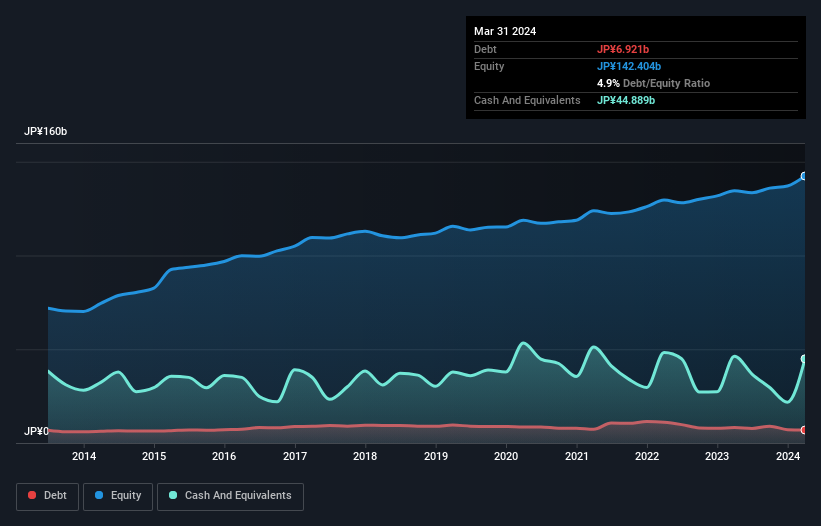
How Much Debt Does Yurtec Carry?
The image below, which you can click on for greater detail, shows that Yurtec had debt of JP¥6.92b at the end of March 2024, a reduction from JP¥8.26b over a year. However, its balance sheet shows it holds JP¥44.9b in cash, so it actually has JP¥38.0b net cash.
How Healthy Is Yurtec's Balance Sheet?
Zooming in on the latest balance sheet data, we can see that Yurtec had liabilities of JP¥66.9b due within 12 months and liabilities of JP¥22.2b due beyond that. Offsetting this, it had JP¥44.9b in cash and JP¥99.6b in receivables that were due within 12 months. So it actually has JP¥55.4b more liquid assets than total liabilities.
This luscious liquidity implies that Yurtec's balance sheet is sturdy like a giant sequoia tree. With this in mind one could posit that its balance sheet means the company is able to handle some adversity. Simply put, the fact that Yurtec has more cash than debt is arguably a good indication that it can manage its debt safely.
And we also note warmly that Yurtec grew its EBIT by 11% last year, making its debt load easier to handle. When analysing debt levels, the balance sheet is the obvious place to start. But it is Yurtec's earnings that will influence how the balance sheet holds up in the future. So if you're keen to discover more about its earnings, it might be worth checking out this graph of its long term earnings trend.
Finally, a business needs free cash flow to pay off debt; accounting profits just don't cut it. Yurtec may have net cash on the balance sheet, but it is still interesting to look at how well the business converts its earnings before interest and tax (EBIT) to free cash flow, because that will influence both its need for, and its capacity to manage debt. In the last three years, Yurtec's free cash flow amounted to 31% of its EBIT, less than we'd expect. That's not great, when it comes to paying down debt.
Summing Up
While we empathize with investors who find debt concerning, you should keep in mind that Yurtec has net cash of JP¥38.0b, as well as more liquid assets than liabilities. And it also grew its EBIT by 11% over the last year. So is Yurtec's debt a risk? It doesn't seem so to us. There's no doubt that we learn most about debt from the balance sheet. However, not all investment risk resides within the balance sheet - far from it. To that end, you should be aware of the 2 warning signs we've spotted with Yurtec .
When all is said and done, sometimes its easier to focus on companies that don't even need debt. Readers can access a list of growth stocks with zero net debt 100% free, right now.
New: Manage All Your Stock Portfolios in One Place
We've created the ultimate portfolio companion for stock investors, and it's free.
• Connect an unlimited number of Portfolios and see your total in one currency
• Be alerted to new Warning Signs or Risks via email or mobile
• Track the Fair Value of your stocks
Have feedback on this article? Concerned about the content? Get in touch with us directly. Alternatively, email editorial-team (at) simplywallst.com.
This article by Simply Wall St is general in nature. We provide commentary based on historical data and analyst forecasts only using an unbiased methodology and our articles are not intended to be financial advice. It does not constitute a recommendation to buy or sell any stock, and does not take account of your objectives, or your financial situation. We aim to bring you long-term focused analysis driven by fundamental data. Note that our analysis may not factor in the latest price-sensitive company announcements or qualitative material. Simply Wall St has no position in any stocks mentioned.
About TSE:1934
Yurtec
Operates as a facility engineering company in Japan and internationally.
Flawless balance sheet with solid track record and pays a dividend.
Market Insights


Advertisement
Community Narratives
Pole position to benefit from GENIUS Act
Fair Value US$233.04|59.1% undervalued
CH
Community Contributor
IREN will transform from bitcoin miner to leader in AI infrastructure
Fair Value US$21.48|15.5% undervalued
KA
Community Contributor
Behind the Assay: XRF Scientific’s Role in Modern Mining Economics
Fair Value AU$2.10|2.4% undervalued
RO
Community Contributor