- Japan
- /
- Construction
- /
- TSE:1887
JDC Corporation's (TSE:1887) Earnings Haven't Escaped The Attention Of Investors


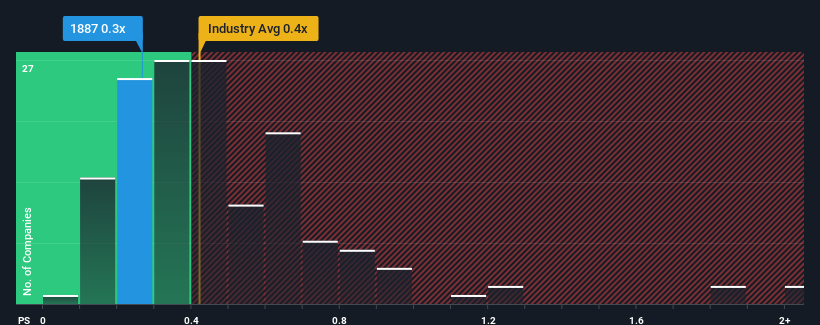
With a median price-to-sales (or "P/S") ratio of close to 0.4x in the Construction industry in Japan, you could be forgiven for feeling indifferent about JDC Corporation's (TSE:1887) P/S ratio of 0.3x. Although, it's not wise to simply ignore the P/S without explanation as investors may be disregarding a distinct opportunity or a costly mistake.
Check out our latest analysis for JDC
What Does JDC's P/S Mean For Shareholders?
For example, consider that JDC's financial performance has been poor lately as its revenue has been in decline. It might be that many expect the company to put the disappointing revenue performance behind them over the coming period, which has kept the P/S from falling. If you like the company, you'd at least be hoping this is the case so that you could potentially pick up some stock while it's not quite in favour.
Want the full picture on earnings, revenue and cash flow for the company? Then our free report on JDC will help you shine a light on its historical performance.What Are Revenue Growth Metrics Telling Us About The P/S?
In order to justify its P/S ratio, JDC would need to produce growth that's similar to the industry.
Retrospectively, the last year delivered a frustrating 12% decrease to the company's top line. This has soured the latest three-year period, which nevertheless managed to deliver a decent 15% overall rise in revenue. So we can start by confirming that the company has generally done a good job of growing revenue over that time, even though it had some hiccups along the way.
Weighing that recent medium-term revenue trajectory against the broader industry's one-year forecast for expansion of 4.5% shows it's about the same on an annualised basis.
With this information, we can see why JDC is trading at a fairly similar P/S to the industry. It seems most investors are expecting to see average growth rates continue into the future and are only willing to pay a moderate amount for the stock.
The Bottom Line On JDC's P/S
Generally, our preference is to limit the use of the price-to-sales ratio to establishing what the market thinks about the overall health of a company.
It appears to us that JDC maintains its moderate P/S off the back of its recent three-year growth being in line with the wider industry forecast. With previous revenue trends that keep up with the current industry outlook, it's hard to justify the company's P/S ratio deviating much from it's current point. If recent medium-term revenue trends continue, it's hard to see the share price moving strongly in either direction in the near future under these circumstances.
It's always necessary to consider the ever-present spectre of investment risk. We've identified 2 warning signs with JDC, and understanding these should be part of your investment process.
If companies with solid past earnings growth is up your alley, you may wish to see this free collection of other companies with strong earnings growth and low P/E ratios.
New: Manage All Your Stock Portfolios in One Place
We've created the ultimate portfolio companion for stock investors, and it's free.
• Connect an unlimited number of Portfolios and see your total in one currency
• Be alerted to new Warning Signs or Risks via email or mobile
• Track the Fair Value of your stocks
Have feedback on this article? Concerned about the content? Get in touch with us directly. Alternatively, email editorial-team (at) simplywallst.com.
This article by Simply Wall St is general in nature. We provide commentary based on historical data and analyst forecasts only using an unbiased methodology and our articles are not intended to be financial advice. It does not constitute a recommendation to buy or sell any stock, and does not take account of your objectives, or your financial situation. We aim to bring you long-term focused analysis driven by fundamental data. Note that our analysis may not factor in the latest price-sensitive company announcements or qualitative material. Simply Wall St has no position in any stocks mentioned.
Have feedback on this article? Concerned about the content? Get in touch with us directly. Alternatively, email editorial-team@simplywallst.com
About TSE:1887
JDC
Provides civil engineering and construction works in Japan and internationally.
Good value with adequate balance sheet.
Market Insights

Community Narratives


