- Japan
- /
- Construction
- /
- TSE:1775
Fuji Furukawa Engineering & Construction Co.Ltd. (TSE:1775) Might Not Be As Mispriced As It Looks After Plunging 29%


Fuji Furukawa Engineering & Construction Co.Ltd. (TSE:1775) shares have had a horrible month, losing 29% after a relatively good period beforehand. Longer-term, the stock has been solid despite a difficult 30 days, gaining 25% in the last year.
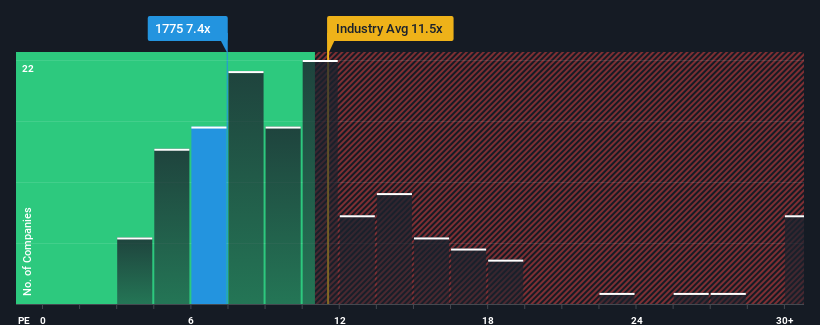
Although its price has dipped substantially, Fuji Furukawa Engineering & ConstructionLtd's price-to-earnings (or "P/E") ratio of 7.4x might still make it look like a buy right now compared to the market in Japan, where around half of the companies have P/E ratios above 14x and even P/E's above 21x are quite common. However, the P/E might be low for a reason and it requires further investigation to determine if it's justified.
The earnings growth achieved at Fuji Furukawa Engineering & ConstructionLtd over the last year would be more than acceptable for most companies. One possibility is that the P/E is low because investors think this respectable earnings growth might actually underperform the broader market in the near future. If that doesn't eventuate, then existing shareholders have reason to be optimistic about the future direction of the share price.
Check out our latest analysis for Fuji Furukawa Engineering & ConstructionLtd
What Are Growth Metrics Telling Us About The Low P/E?
There's an inherent assumption that a company should underperform the market for P/E ratios like Fuji Furukawa Engineering & ConstructionLtd's to be considered reasonable.
Retrospectively, the last year delivered an exceptional 30% gain to the company's bottom line. The latest three year period has also seen an excellent 63% overall rise in EPS, aided by its short-term performance. Therefore, it's fair to say the earnings growth recently has been superb for the company.
This is in contrast to the rest of the market, which is expected to grow by 9.8% over the next year, materially lower than the company's recent medium-term annualised growth rates.
In light of this, it's peculiar that Fuji Furukawa Engineering & ConstructionLtd's P/E sits below the majority of other companies. Apparently some shareholders believe the recent performance has exceeded its limits and have been accepting significantly lower selling prices.
The Bottom Line On Fuji Furukawa Engineering & ConstructionLtd's P/E
Fuji Furukawa Engineering & ConstructionLtd's recently weak share price has pulled its P/E below most other companies. It's argued the price-to-earnings ratio is an inferior measure of value within certain industries, but it can be a powerful business sentiment indicator.
We've established that Fuji Furukawa Engineering & ConstructionLtd currently trades on a much lower than expected P/E since its recent three-year growth is higher than the wider market forecast. There could be some major unobserved threats to earnings preventing the P/E ratio from matching this positive performance. At least price risks look to be very low if recent medium-term earnings trends continue, but investors seem to think future earnings could see a lot of volatility.
Having said that, be aware Fuji Furukawa Engineering & ConstructionLtd is showing 1 warning sign in our investment analysis, you should know about.
Of course, you might also be able to find a better stock than Fuji Furukawa Engineering & ConstructionLtd. So you may wish to see this free collection of other companies that have reasonable P/E ratios and have grown earnings strongly.
If you're looking to trade Fuji Furukawa Engineering & ConstructionLtd, open an account with the lowest-cost platform trusted by professionals, Interactive Brokers.
With clients in over 200 countries and territories, and access to 160 markets, IBKR lets you trade stocks, options, futures, forex, bonds and funds from a single integrated account.
Enjoy no hidden fees, no account minimums, and FX conversion rates as low as 0.03%, far better than what most brokers offer.
Sponsored ContentNew: AI Stock Screener & Alerts
Our new AI Stock Screener scans the market every day to uncover opportunities.
• Dividend Powerhouses (3%+ Yield)
• Undervalued Small Caps with Insider Buying
• High growth Tech and AI Companies
Or build your own from over 50 metrics.
Have feedback on this article? Concerned about the content? Get in touch with us directly. Alternatively, email editorial-team (at) simplywallst.com.
This article by Simply Wall St is general in nature. We provide commentary based on historical data and analyst forecasts only using an unbiased methodology and our articles are not intended to be financial advice. It does not constitute a recommendation to buy or sell any stock, and does not take account of your objectives, or your financial situation. We aim to bring you long-term focused analysis driven by fundamental data. Note that our analysis may not factor in the latest price-sensitive company announcements or qualitative material. Simply Wall St has no position in any stocks mentioned.
Have feedback on this article? Concerned about the content? Get in touch with us directly. Alternatively, email editorial-team@simplywallst.com
About TSE:1775
Fuji Furukawa Engineering & ConstructionLtd
Fuji Furukawa Engineering & Construction Co.Ltd.
Flawless balance sheet established dividend payer.
Market Insights

Community Narratives

