Nihon Dengi's (TSE:1723) five-year earnings growth trails the 21% YoY shareholder returns


When you buy shares in a company, it's worth keeping in mind the possibility that it could fail, and you could lose your money. But when you pick a company that is really flourishing, you can make more than 100%. Long term Nihon Dengi Co., Ltd. (TSE:1723) shareholders would be well aware of this, since the stock is up 116% in five years. Also pleasing for shareholders was the 42% gain in the last three months. The company reported its financial results recently; you can catch up on the latest numbers by reading our company report.
Since it's been a strong week for Nihon Dengi shareholders, let's have a look at trend of the longer term fundamentals.
Check out our latest analysis for Nihon Dengi
To paraphrase Benjamin Graham: Over the short term the market is a voting machine, but over the long term it's a weighing machine. By comparing earnings per share (EPS) and share price changes over time, we can get a feel for how investor attitudes to a company have morphed over time.
Over half a decade, Nihon Dengi managed to grow its earnings per share at 12% a year. This EPS growth is lower than the 17% average annual increase in the share price. This suggests that market participants hold the company in higher regard, these days. And that's hardly shocking given the track record of growth.
The image below shows how EPS has tracked over time (if you click on the image you can see greater detail).
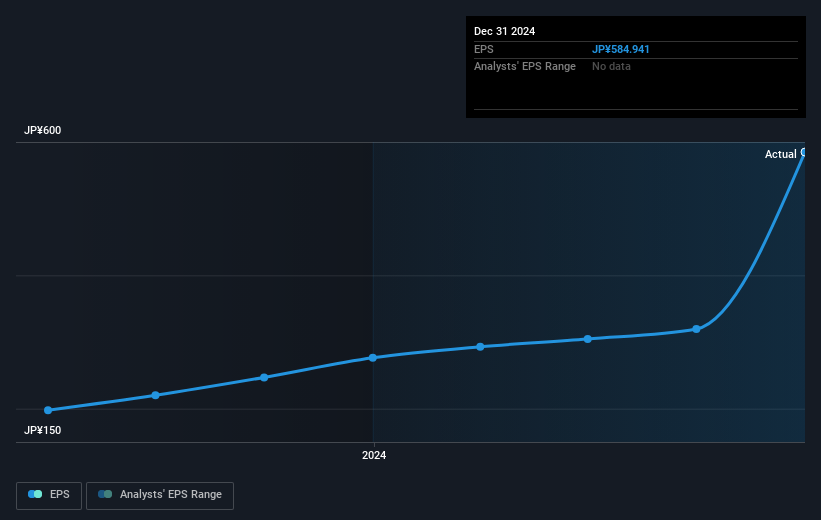
Dive deeper into Nihon Dengi's key metrics by checking this interactive graph of Nihon Dengi's earnings, revenue and cash flow.
What About Dividends?
As well as measuring the share price return, investors should also consider the total shareholder return (TSR). The TSR incorporates the value of any spin-offs or discounted capital raisings, along with any dividends, based on the assumption that the dividends are reinvested. So for companies that pay a generous dividend, the TSR is often a lot higher than the share price return. As it happens, Nihon Dengi's TSR for the last 5 years was 162%, which exceeds the share price return mentioned earlier. The dividends paid by the company have thusly boosted the total shareholder return.
A Different Perspective
It's good to see that Nihon Dengi has rewarded shareholders with a total shareholder return of 48% in the last twelve months. And that does include the dividend. That gain is better than the annual TSR over five years, which is 21%. Therefore it seems like sentiment around the company has been positive lately. Given the share price momentum remains strong, it might be worth taking a closer look at the stock, lest you miss an opportunity. It's always interesting to track share price performance over the longer term. But to understand Nihon Dengi better, we need to consider many other factors. Take risks, for example - Nihon Dengi has 1 warning sign we think you should be aware of.
We will like Nihon Dengi better if we see some big insider buys. While we wait, check out this free list of undervalued stocks (mostly small caps) with considerable, recent, insider buying.
Please note, the market returns quoted in this article reflect the market weighted average returns of stocks that currently trade on Japanese exchanges.
Valuation is complex, but we're here to simplify it.
Discover if Nihon Dengi might be undervalued or overvalued with our detailed analysis, featuring fair value estimates, potential risks, dividends, insider trades, and its financial condition.
Access Free AnalysisHave feedback on this article? Concerned about the content? Get in touch with us directly. Alternatively, email editorial-team (at) simplywallst.com.
This article by Simply Wall St is general in nature. We provide commentary based on historical data and analyst forecasts only using an unbiased methodology and our articles are not intended to be financial advice. It does not constitute a recommendation to buy or sell any stock, and does not take account of your objectives, or your financial situation. We aim to bring you long-term focused analysis driven by fundamental data. Note that our analysis may not factor in the latest price-sensitive company announcements or qualitative material. Simply Wall St has no position in any stocks mentioned.
About TSE:1723
Flawless balance sheet with solid track record.
Market Insights

Community Narratives


