
Advertisement
- Japan
- /
- Trade Distributors
- /
- TSE:7531
What Seiwa Chuo Holdings' (TYO:7531) Returns On Capital Can Tell Us
If we're looking to avoid a business that is in decline, what are the trends that can warn us ahead of time? When we see a declining return on capital employed (ROCE) in conjunction with a declining base of capital employed, that's often how a mature business shows signs of aging. This indicates to us that the business is not only shrinking the size of its net assets, but its returns are falling as well. In light of that, from a first glance at Seiwa Chuo Holdings (TYO:7531), we've spotted some signs that it could be struggling, so let's investigate.
Return On Capital Employed (ROCE): What is it?
Just to clarify if you're unsure, ROCE is a metric for evaluating how much pre-tax income (in percentage terms) a company earns on the capital invested in its business. The formula for this calculation on Seiwa Chuo Holdings is:
Return on Capital Employed = Earnings Before Interest and Tax (EBIT) ÷ (Total Assets - Current Liabilities)
0.0099 = JP¥152m ÷ (JP¥26b - JP¥11b) (Based on the trailing twelve months to September 2020).
So, Seiwa Chuo Holdings has an ROCE of 1.0%. In absolute terms, that's a low return and it also under-performs the Trade Distributors industry average of 6.1%.
See our latest analysis for Seiwa Chuo Holdings
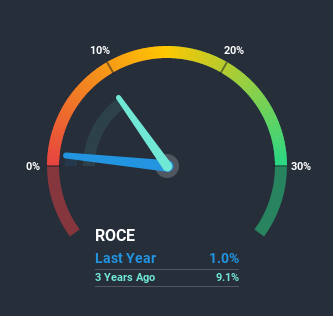
While the past is not representative of the future, it can be helpful to know how a company has performed historically, which is why we have this chart above. If you'd like to look at how Seiwa Chuo Holdings has performed in the past in other metrics, you can view this free graph of past earnings, revenue and cash flow.
What Can We Tell From Seiwa Chuo Holdings' ROCE Trend?
There is reason to be cautious about Seiwa Chuo Holdings, given the returns are trending downwards. To be more specific, the ROCE was 5.5% five years ago, but since then it has dropped noticeably. And on the capital employed front, the business is utilizing roughly the same amount of capital as it was back then. Since returns are falling and the business has the same amount of assets employed, this can suggest it's a mature business that hasn't had much growth in the last five years. If these trends continue, we wouldn't expect Seiwa Chuo Holdings to turn into a multi-bagger.
On a related note, Seiwa Chuo Holdings has decreased its current liabilities to 42% of total assets. That could partly explain why the ROCE has dropped. What's more, this can reduce some aspects of risk to the business because now the company's suppliers or short-term creditors are funding less of its operations. Some would claim this reduces the business' efficiency at generating ROCE since it is now funding more of the operations with its own money. Keep in mind 42% is still pretty high, so those risks are still somewhat prevalent.Our Take On Seiwa Chuo Holdings' ROCE
In summary, it's unfortunate that Seiwa Chuo Holdings is generating lower returns from the same amount of capital. Investors haven't taken kindly to these developments, since the stock has declined 26% from where it was five years ago. That being the case, unless the underlying trends revert to a more positive trajectory, we'd consider looking elsewhere.
Seiwa Chuo Holdings does have some risks, we noticed 2 warning signs (and 1 which is potentially serious) we think you should know about.
While Seiwa Chuo Holdings may not currently earn the highest returns, we've compiled a list of companies that currently earn more than 25% return on equity. Check out this free list here.
When trading Seiwa Chuo Holdings or any other investment, use the platform considered by many to be the Professional's Gateway to the Worlds Market, Interactive Brokers. You get the lowest-cost* trading on stocks, options, futures, forex, bonds and funds worldwide from a single integrated account. Promoted
New: Manage All Your Stock Portfolios in One Place
We've created the ultimate portfolio companion for stock investors, and it's free.
• Connect an unlimited number of Portfolios and see your total in one currency
• Be alerted to new Warning Signs or Risks via email or mobile
• Track the Fair Value of your stocks
This article by Simply Wall St is general in nature. It does not constitute a recommendation to buy or sell any stock, and does not take account of your objectives, or your financial situation. We aim to bring you long-term focused analysis driven by fundamental data. Note that our analysis may not factor in the latest price-sensitive company announcements or qualitative material. Simply Wall St has no position in any stocks mentioned.
*Interactive Brokers Rated Lowest Cost Broker by StockBrokers.com Annual Online Review 2020
Have feedback on this article? Concerned about the content? Get in touch with us directly. Alternatively, email editorial-team (at) simplywallst.com.
About TSE:7531
Seiwa Chuo Holdings
Engages in the wholesale of general steel products in Japan.
Excellent balance sheet and good value.
Market Insights

Advertisement
Community Narratives
Quality at a Premium. A time to watch, not to buy?
Fair Value US$154.56|29.9% undervalued
DA
Community Contributor
GRAB: The Super-App at the Heart of Southeast Asia’s Digital Boom
Fair Value US$8.20|22.9% undervalued
BL
Community Contributor
Verve Group to Surge with 51.61% Revenue Growth
Fair Value €6.00|64.1% undervalued
ME
Community Contributor