
Advertisement
- Japan
- /
- Trade Distributors
- /
- TSE:7531
Seiwa Chuo Holdings Corporation's (TYO:7531) Financials Are Too Obscure To Link With Current Share Price Momentum: What's In Store For the Stock?

Seiwa Chuo Holdings (TYO:7531) has had a great run on the share market with its stock up by a significant 41% over the last three months. However, we decided to pay attention to the company's fundamentals which don't appear to give a clear sign about the company's financial health. Specifically, we decided to study Seiwa Chuo Holdings' ROE in this article.
Return on equity or ROE is a key measure used to assess how efficiently a company's management is utilizing the company's capital. Simply put, it is used to assess the profitability of a company in relation to its equity capital.
View our latest analysis for Seiwa Chuo Holdings
How Do You Calculate Return On Equity?
Return on equity can be calculated by using the formula:
Return on Equity = Net Profit (from continuing operations) ÷ Shareholders' Equity
So, based on the above formula, the ROE for Seiwa Chuo Holdings is:
0.9% = JP¥132m ÷ JP¥14b (Based on the trailing twelve months to September 2020).
The 'return' is the yearly profit. That means that for every ¥1 worth of shareholders' equity, the company generated ¥0.01 in profit.
What Has ROE Got To Do With Earnings Growth?
So far, we've learned that ROE is a measure of a company's profitability. Based on how much of its profits the company chooses to reinvest or "retain", we are then able to evaluate a company's future ability to generate profits. Assuming all else is equal, companies that have both a higher return on equity and higher profit retention are usually the ones that have a higher growth rate when compared to companies that don't have the same features.
Seiwa Chuo Holdings' Earnings Growth And 0.9% ROE
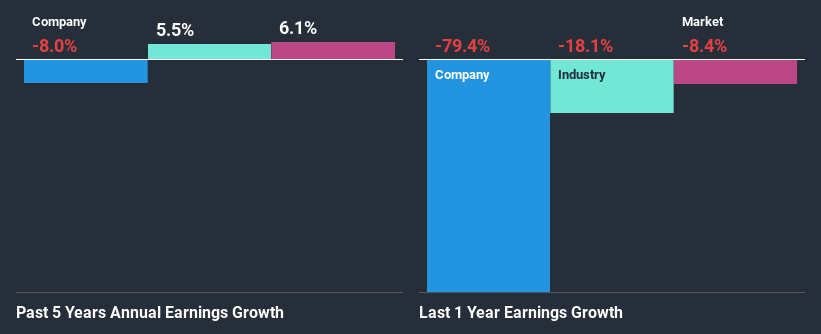
It is quite clear that Seiwa Chuo Holdings' ROE is rather low. Even compared to the average industry ROE of 6.0%, the company's ROE is quite dismal. Given the circumstances, the significant decline in net income by 8.0% seen by Seiwa Chuo Holdings over the last five years is not surprising. However, there could also be other factors causing the earnings to decline. For instance, the company has a very high payout ratio, or is faced with competitive pressures.
However, when we compared Seiwa Chuo Holdings' growth with the industry we found that while the company's earnings have been shrinking, the industry has seen an earnings growth of 5.5% in the same period. This is quite worrisome.
The basis for attaching value to a company is, to a great extent, tied to its earnings growth. The investor should try to establish if the expected growth or decline in earnings, whichever the case may be, is priced in. Doing so will help them establish if the stock's future looks promising or ominous. One good indicator of expected earnings growth is the P/E ratio which determines the price the market is willing to pay for a stock based on its earnings prospects. So, you may want to check if Seiwa Chuo Holdings is trading on a high P/E or a low P/E, relative to its industry.
Is Seiwa Chuo Holdings Efficiently Re-investing Its Profits?
Seiwa Chuo Holdings' low three-year median payout ratio of 24% (or a retention ratio of 76%) over the last three years should mean that the company is retaining most of its earnings to fuel its growth but the company's earnings have actually shrunk. The low payout should mean that the company is retaining most of its earnings and consequently, should see some growth. It looks like there might be some other reasons to explain the lack in that respect. For example, the business could be in decline.
Moreover, Seiwa Chuo Holdings has been paying dividends for at least ten years or more suggesting that management must have perceived that the shareholders prefer dividends over earnings growth.
Conclusion
Overall, we have mixed feelings about Seiwa Chuo Holdings. While the company does have a high rate of profit retention, its low rate of return is probably hampering its earnings growth. Wrapping up, we would proceed with caution with this company and one way of doing that would be to look at the risk profile of the business. To know the 3 risks we have identified for Seiwa Chuo Holdings visit our risks dashboard for free.
If you decide to trade Seiwa Chuo Holdings, use the lowest-cost* platform that is rated #1 Overall by Barron’s, Interactive Brokers. Trade stocks, options, futures, forex, bonds and funds on 135 markets, all from a single integrated account. Promoted
New: Manage All Your Stock Portfolios in One Place
We've created the ultimate portfolio companion for stock investors, and it's free.
• Connect an unlimited number of Portfolios and see your total in one currency
• Be alerted to new Warning Signs or Risks via email or mobile
• Track the Fair Value of your stocks
This article by Simply Wall St is general in nature. It does not constitute a recommendation to buy or sell any stock, and does not take account of your objectives, or your financial situation. We aim to bring you long-term focused analysis driven by fundamental data. Note that our analysis may not factor in the latest price-sensitive company announcements or qualitative material. Simply Wall St has no position in any stocks mentioned.
*Interactive Brokers Rated Lowest Cost Broker by StockBrokers.com Annual Online Review 2020
Have feedback on this article? Concerned about the content? Get in touch with us directly. Alternatively, email editorial-team (at) simplywallst.com.
About TSE:7531
Seiwa Chuo Holdings
Engages in the wholesale of general steel products in Japan.
Excellent balance sheet and fair value.
Market Insights

Advertisement
Community Narratives

Apple: A Dying Star with an Overpriced Valuation
Fair Value US$177.34|18.9% overvalued
IN
Community Contributor
Avino a case for USD$20 per share within 5 years (assuming $3,500 gold, $100 silver and $4 copper).
Fair Value CA$26.79|87.5% undervalued
AG
Community Contributor
Riding the Defense Boom RENK Sees Revenue Climb at 15% CAGR by FY 2029
Fair Value €69.87|20.5% undervalued
CH
Community Contributor