
Advertisement
Sumitomo Mitsui Trust Group Full Year 2025 Earnings: Beats Expectations

Sumitomo Mitsui Trust Group (TSE:8309) Full Year 2025 Results
Key Financial Results
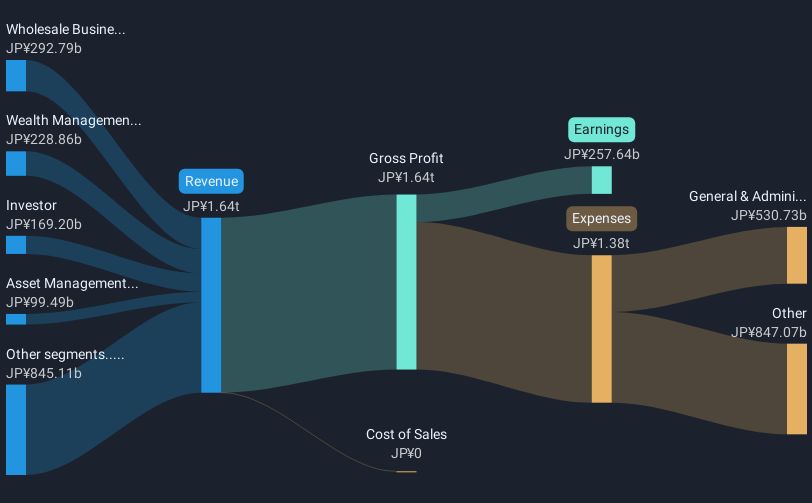
- Revenue: JP¥1.64t (up 60% from FY 2024).
- Net income: JP¥257.6b (up 225% from FY 2024).
- Profit margin: 16% (up from 7.7% in FY 2024). The increase in margin was driven by higher revenue.
- EPS: JP¥360 (up from JP¥109 in FY 2024).
8309 Banking Performance Indicators
- Cost-to-income ratio: 51.9% (down from 61.3% in FY 2024).
- Non-performing loans: 0.32% (down from 0.34% in FY 2024).
All figures shown in the chart above are for the trailing 12 month (TTM) period
Sumitomo Mitsui Trust Group Revenues and Earnings Beat Expectations
Revenue exceeded analyst estimates by 1.4%. Earnings per share (EPS) also surpassed analyst estimates by 2.5%.
The primary driver behind last 12 months revenue was the Wholesale Business segment contributing a total revenue of JP¥292.8b (18% of total revenue). Explore how 8309's revenue and expenses shape its earnings.
Looking ahead, revenue is expected to decline by 12% p.a. on average during the next 3 years, while revenues in the Banks industry in Japan are expected to grow by 2.5%.
Performance of the Japanese Banks industry.
The company's shares are up 6.7% from a week ago.
Balance Sheet Analysis
Just as investors must consider earnings, it is also important to take into account the strength of a company's balance sheet. We've done some analysis and you can see our take on Sumitomo Mitsui Trust Group's balance sheet.
New: Manage All Your Stock Portfolios in One Place
We've created the ultimate portfolio companion for stock investors, and it's free.
• Connect an unlimited number of Portfolios and see your total in one currency
• Be alerted to new Warning Signs or Risks via email or mobile
• Track the Fair Value of your stocks
Have feedback on this article? Concerned about the content? Get in touch with us directly. Alternatively, email editorial-team (at) simplywallst.com.
This article by Simply Wall St is general in nature. We provide commentary based on historical data and analyst forecasts only using an unbiased methodology and our articles are not intended to be financial advice. It does not constitute a recommendation to buy or sell any stock, and does not take account of your objectives, or your financial situation. We aim to bring you long-term focused analysis driven by fundamental data. Note that our analysis may not factor in the latest price-sensitive company announcements or qualitative material. Simply Wall St has no position in any stocks mentioned.
About TSE:8309
Sumitomo Mitsui Trust Group
Operates as a trust bank in Japan and internationally.
Solid track record with excellent balance sheet and pays a dividend.
Similar Companies
Market Insights

Advertisement
Community Narratives

Apple: A Dying Star with an Overpriced Valuation
Fair Value US$177.34|19.2% overvalued
IN
Community Contributor
Avino a case for USD$20 per share within 5 years (assuming $3,500 gold, $100 silver and $4 copper).
Fair Value CA$26.79|86.0% undervalued
AG
Community Contributor
Riding the Defense Boom RENK Sees Revenue Climb at 15% CAGR by FY 2029
Fair Value €69.87|20.5% undervalued
CH
Community Contributor